Description
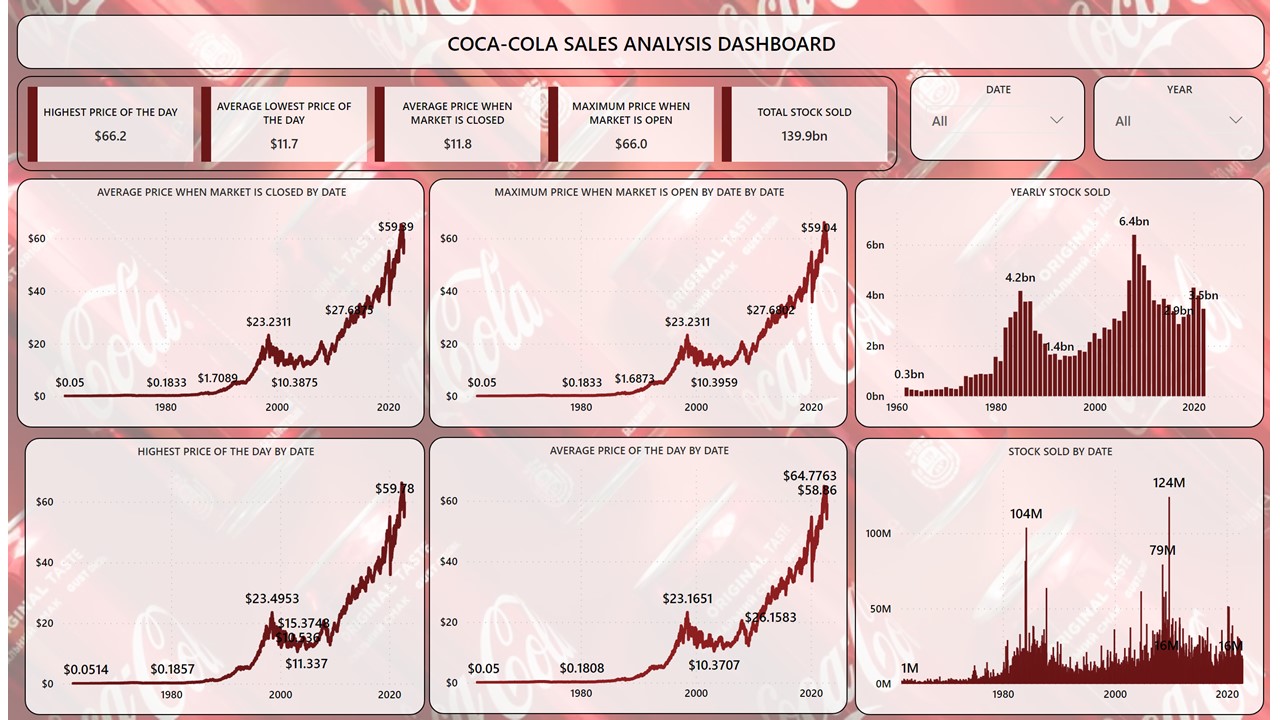
This is the Coca Cola Sales Analysis Dashboard. It shows
1.Highest price of the day
2.Average lowest price of the day
3.Maximum price when market is open
4.Average price when market is closed
5.Total stock sold
6.Year
7.Date
Purpose
The Coca-Cola sales analysis dashboard is designed to provide a detailed examination of key metrics related to the trading and performance of Coca-Cola stocks. By featuring the highest and average lowest prices of the day, maximum price when the market is open, average price when the market is closed, total stock sold, year, and date, the dashboard enables stakeholders to gain insights into the stock’s daily pricing trends, overall trading activity, and yearly performance. This tool is valuable for investors, analysts, and financial professionals seeking to understand the dynamics of Coca-Cola stock prices, identify patterns, and make informed decisions based on historical data and market trends.
Only logged in customers who have purchased this product may leave a review.

Reviews
There are no reviews yet.