
Introduction:
In the fast-paced and competitive landscape of the MicroDataLake industry, gaining actionable insights is crucial for sustainable growth. The Comparative Analysis Dashboard emerges as a transformative tool, offering a panoramic view of sales-related metrics for various products and categories over different time periods. By spotlighting key features such as products, categories, sales dates, budget variance percentage, budget amount, current year sales, previous year sales, year-to-year sales growth percentage, and total sales, this dashboard becomes an invaluable asset for stakeholders seeking a deeper understanding of performance trends.
Features of the Comparative Analysis Dashboard:
Products and Categories Focus:
The dashboard’s primary function is to provide a granular analysis of different products and categories within the MicroDataLake industry.
Stakeholders gain insights into the performance of individual products and categories, enabling strategic decision-making.
Sales Date Visualization:
The inclusion of sales dates allows for a temporal analysis, facilitating the identification of trends and patterns over different time periods.
Stakeholders can pinpoint specific periods of success or challenges, aiding in the formulation of targeted strategies.
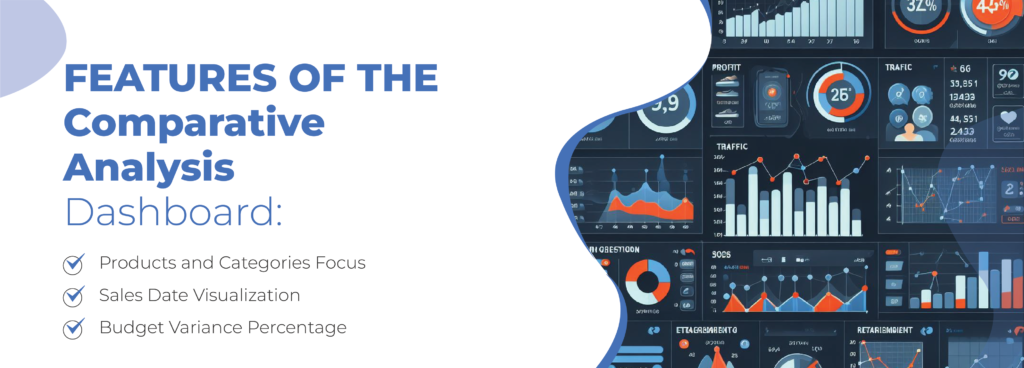
Budget Variance Percentage:
Efficient financial management is at the core of business success. The dashboard calculates and displays budget variance percentages, offering a clear picture of adherence to financial plans.
Decision-makers can quickly identify areas where budgets are exceeding or falling short, streamlining resource allocation.
Budget Amount Tracking:
A transparent representation of budget amounts allocated for each product and category empowers stakeholders to manage resources effectively.
This feature aids in optimizing budget allocation, ensuring that financial resources are aligned with business priorities.
Current Year vs. Previous Year Sales:
Comparative analysis extends to a direct comparison between current year and previous year sales figures.
Stakeholders can gauge the success or decline of products and categories, allowing for proactive decision-making and adjustments to strategies.
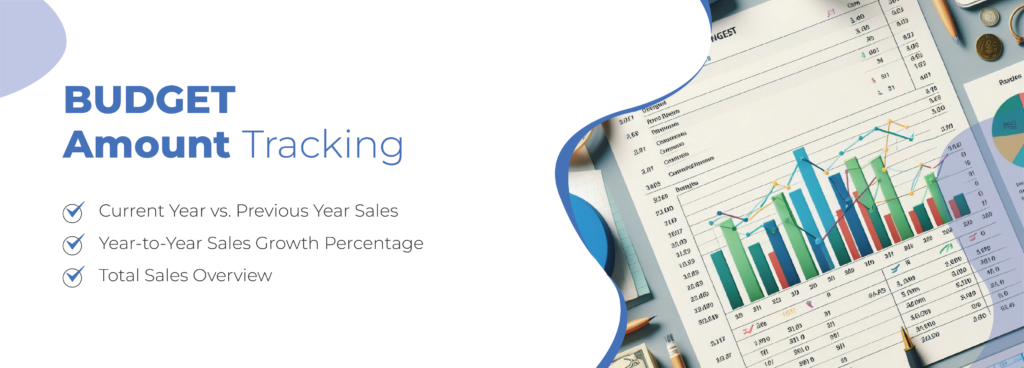
Year-to-Year Sales Growth Percentage:
A critical metric for assessing overall industry health, the year-to-year sales growth percentage provides a quantifiable measure of progress.
This feature enables stakeholders to identify trends and make data-driven decisions to drive sustainable growth.
Total Sales Overview:
The dashboard consolidates data to present a comprehensive overview of total sales within the MicroDataLake industry.
This high-level snapshot is invaluable for executives and decision-makers seeking a quick understanding of the industry’s financial performance.
Conclusion:
In conclusion, the Comparative Analysis Dashboard in the MicroDataLake industry is a strategic tool that empowers stakeholders to navigate the complexities of the market. By providing a visual and comprehensive comparison of key metrics, this dashboard supports strategic planning, budget optimization, and the identification of successful products or categories contributing to overall sales growth. In an industry characterized by rapid evolution, leveraging the features of this dashboard becomes imperative for businesses aiming to thrive and excel.

