Sale!
Description
Description:
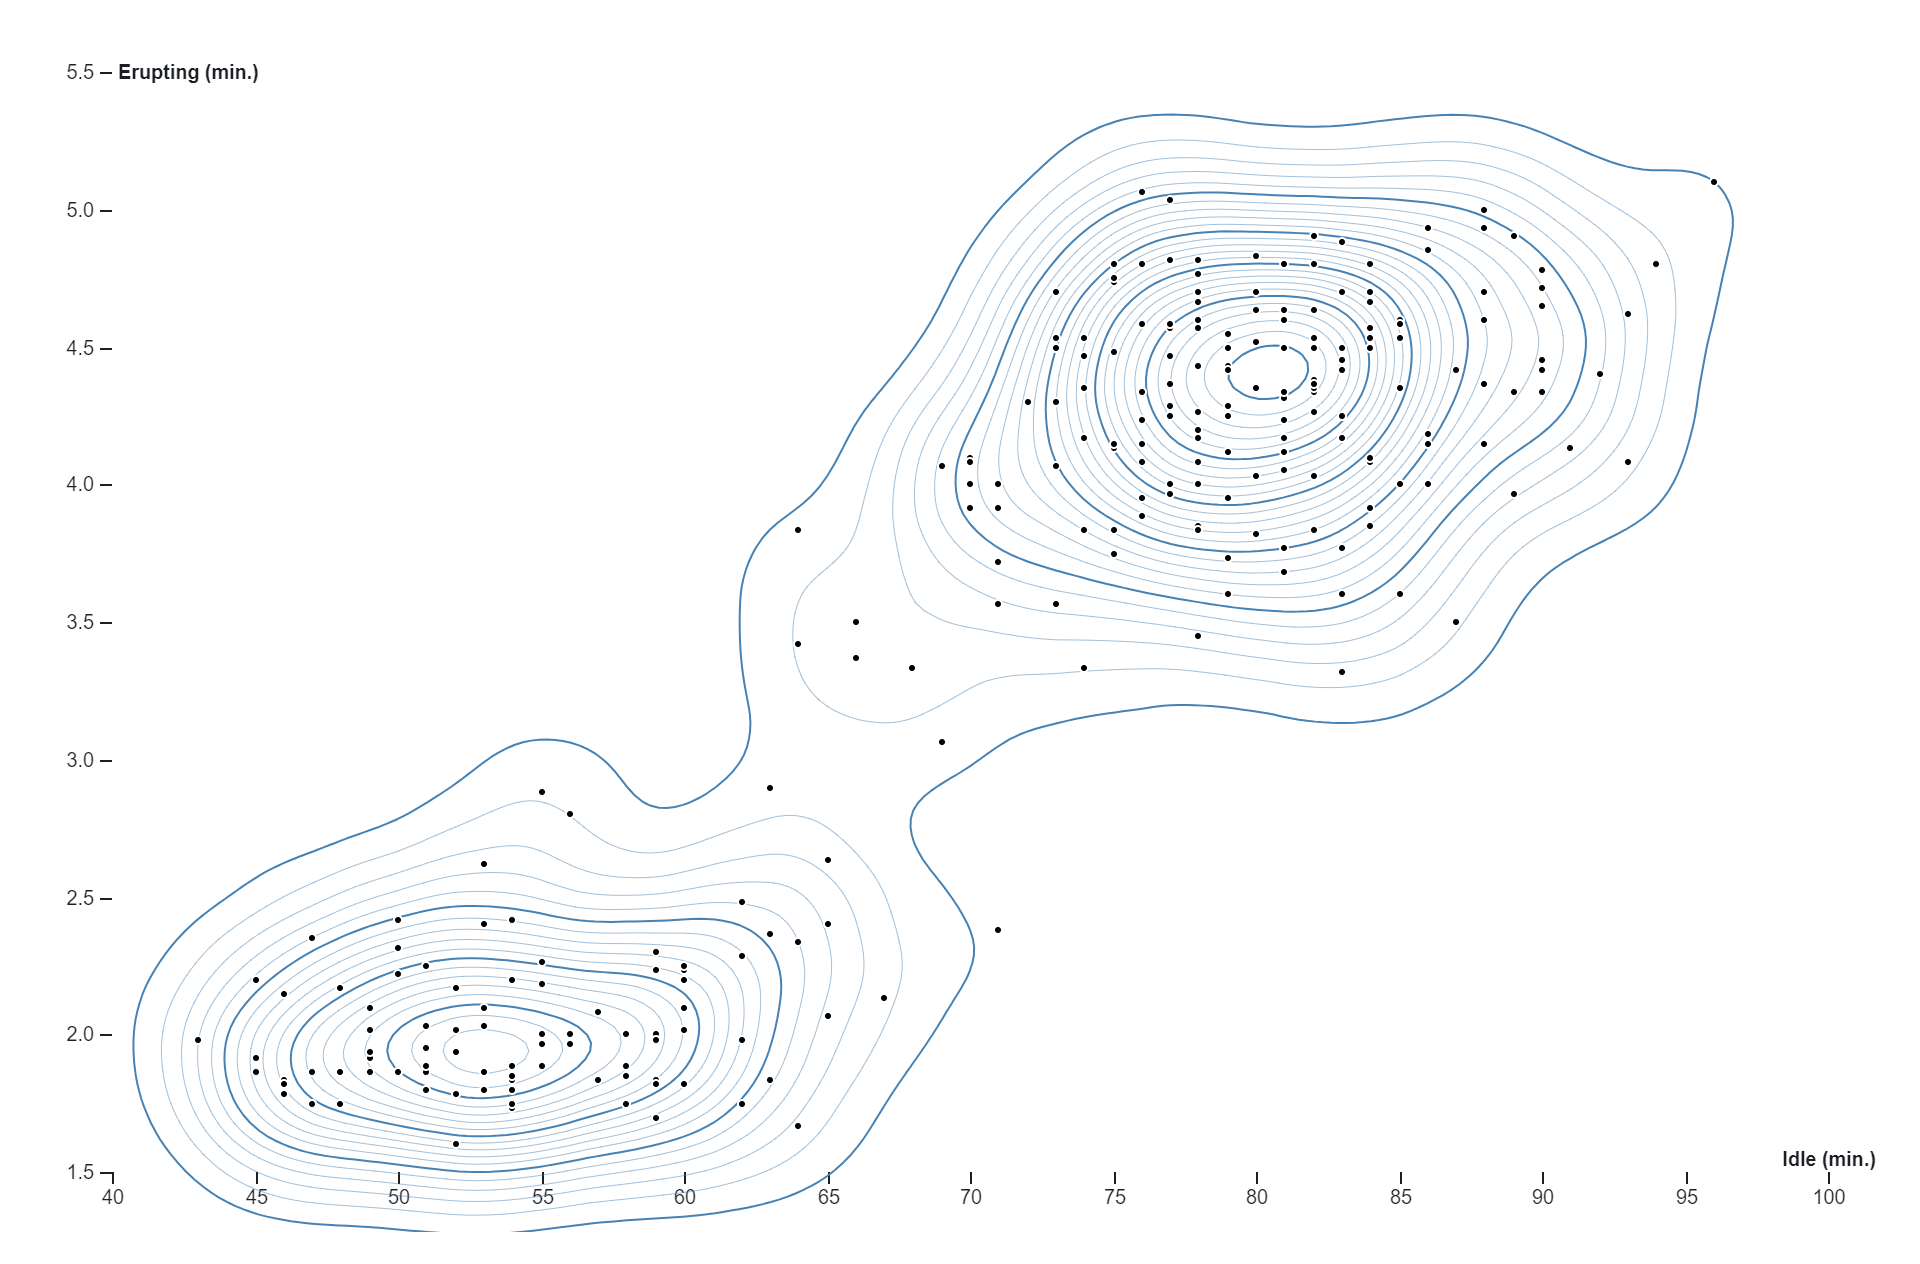
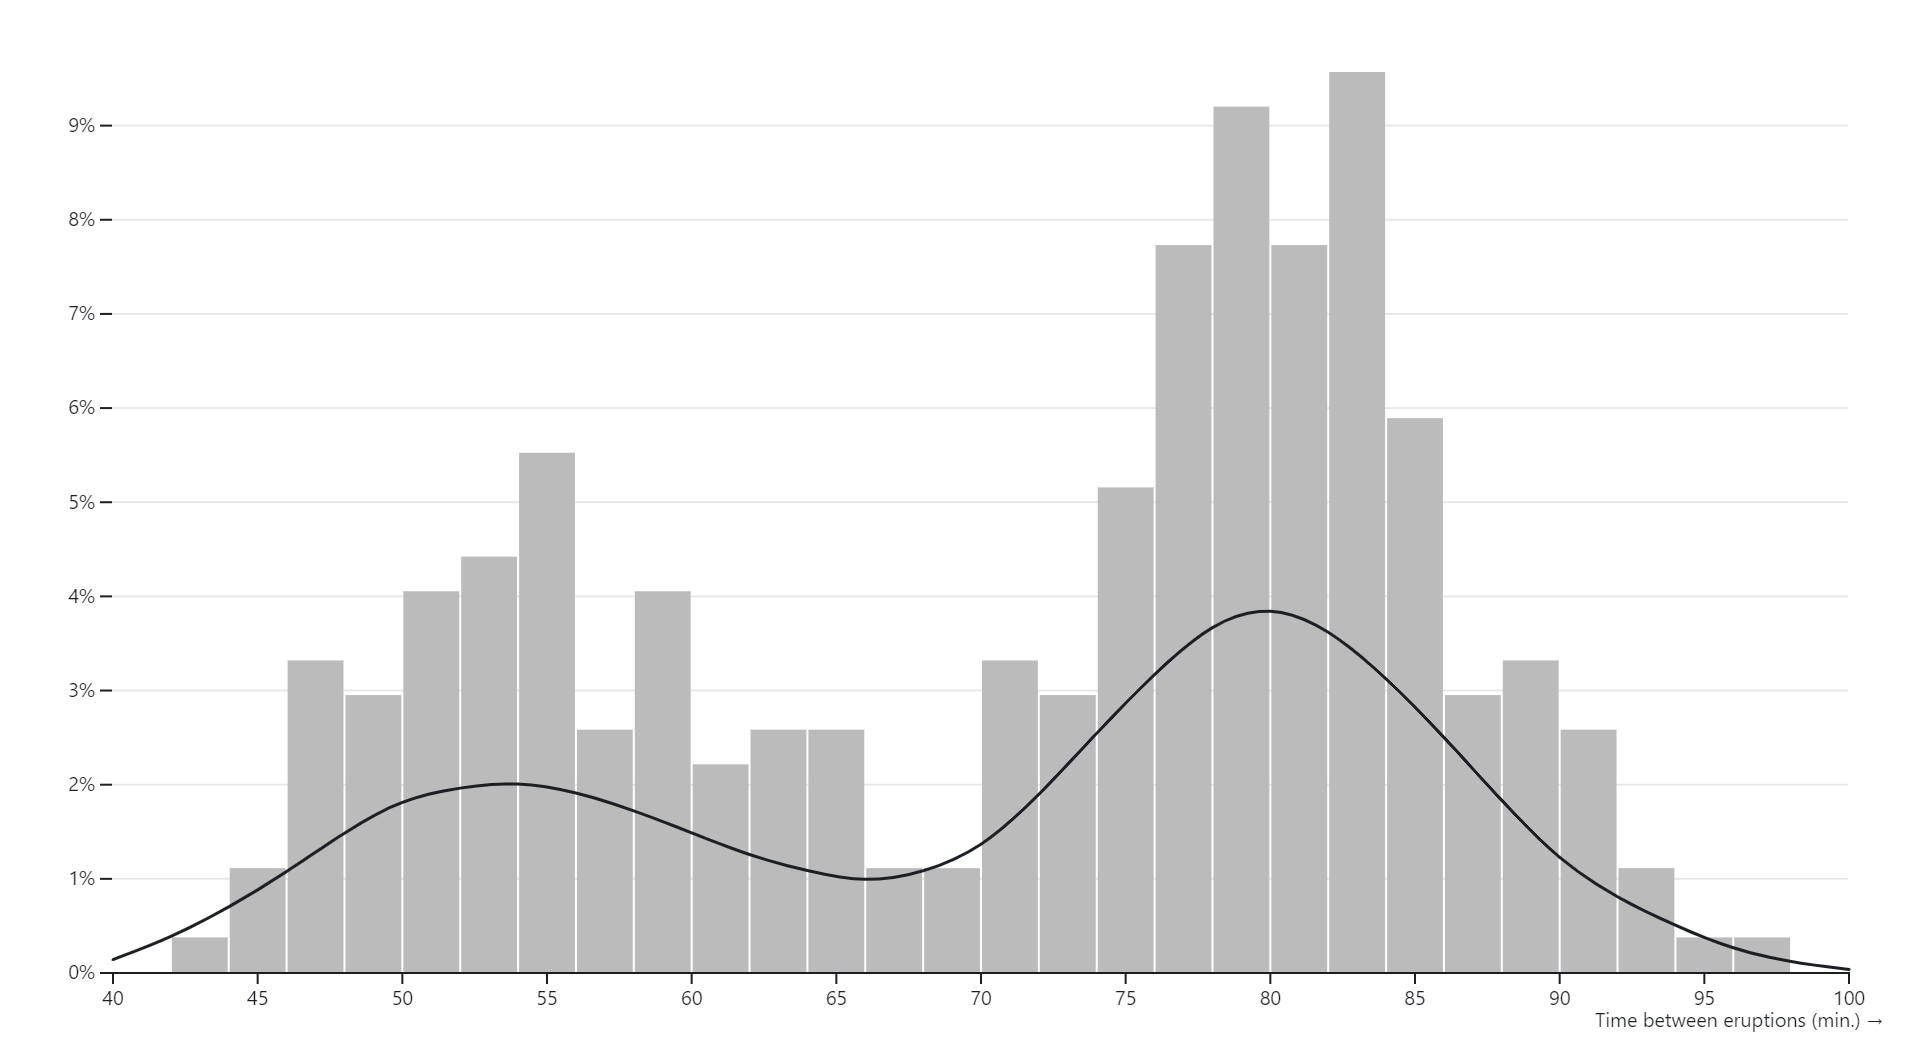
Kernel density estimation (KDE) charts, also known as kernel density plots or kernel density estimates, are graphical representations of the probability density function of a continuous random variable. Unlike histograms, which represent data using discrete bins, KDE charts provide a smooth, continuous estimate of the underlying probability distribution of the data.In a KDE chart, a kernel function is applied to each data point, resulting in a smoothed estimate of the data density across the entire range of values. The kernel function acts as a weighting function that assigns a weight to each data point based on its distance from the point being estimated. The weighted contributions from all data points are then summed to generate the overall density estimate.The bandwidth parameter of the kernel function controls the width of the smoothing window, which determines the degree of smoothing applied to the data. A larger bandwidth results in smoother, more generalized density estimates, while a smaller bandwidth produces sharper, more localized estimates.KDE charts are particularly useful for visualizing the shape, central tendency, and spread of continuous data distributions. They provide a flexible and non-parametric approach to estimating probability densities, making them suitable for a wide range of applications in exploratory data analysis, statistical modeling, and visualization.
Uses:
1. Data Visualization: KDE is often used to visualize the distribution of data, especially when the data is continuous.
2. Exploratory Data Analysis: It helps in understanding the underlying distribution of a dataset, which can aid in identifying patterns or anomalies.
3. Non-parametric Estimation: KDE provides a flexible, non-parametric method for estimating probability density functions without assuming a specific distribution.
4. Smoothing: It can be used to smooth noisy data, providing a clearer representation of underlying trends.
5. Statistical Inference: KDE can be used for statistical inference tasks such as hypothesis testing or confidence interval estimation.
6. Model Validation: It can be used to validate parametric models by comparing the estimated KDE with the assumed distribution.
7. Data Preprocessing: KDE can help in preprocessing steps such as outlier detection or feature engineering by revealing data distribution characteristics.
8. Cluster Analysis: KDE can assist in identifying clusters or density peaks within a dataset, aiding in cluster analysis tasks.
9. Imputation: KDE can be used for missing data imputation by estimating the density of observed data points and inferring missing values based on this density.
10. Simulation: KDE can be used in simulation studies to generate synthetic data that closely resembles the observed dataset’s distribution.
Purposes:
1. Density Estimation: The primary purpose of KDE is to estimate the probability density function of a random variable based on observed data.
2. Smooth Estimation: KDE provides a smoothed estimate of the underlying probability density, which can be useful for various statistical analyses.
3. Distribution Comparison: It allows for comparing the distributions of different datasets or subsets of data.
4. Anomaly Detection: KDE can help in identifying outliers or anomalies by highlighting regions of low probability density.
5. Bandwidth Selection: One purpose of KDE is to determine an appropriate bandwidth parameter, which governs the smoothness of the estimated density.
6. Probability Density Visualization: It provides a way to visually represent the likelihood of different values occurring within a dataset.
7. Sampling: KDE can be used for generating random samples from the estimated probability density function.
8. Continuous Variable Modeling: It is particularly useful when dealing with continuous variables, providing a smooth estimate of their distribution.
9. Prediction: KDE can be used for making predictions or estimating probabilities associated with new observations.
10. Understanding Data Structure: By estimating the density, KDE helps in understanding the structure and characteristics of the data, facilitating further analysis and interpretation.
Only logged in customers who have purchased this product may leave a review.
Related products
-
- Sale!
Clustre Dendogram
-
$ 15Original price was: $ 15.$ 10Current price is: $ 10. - Add to cart
-
- Sale!
Tidy Tree
-
$ 15Original price was: $ 15.$ 10Current price is: $ 10. - Add to cart
-
- Sale!
Circle Packing
-
$ 15Original price was: $ 15.$ 10Current price is: $ 10. - Add to cart

Reviews
There are no reviews yet.