Description
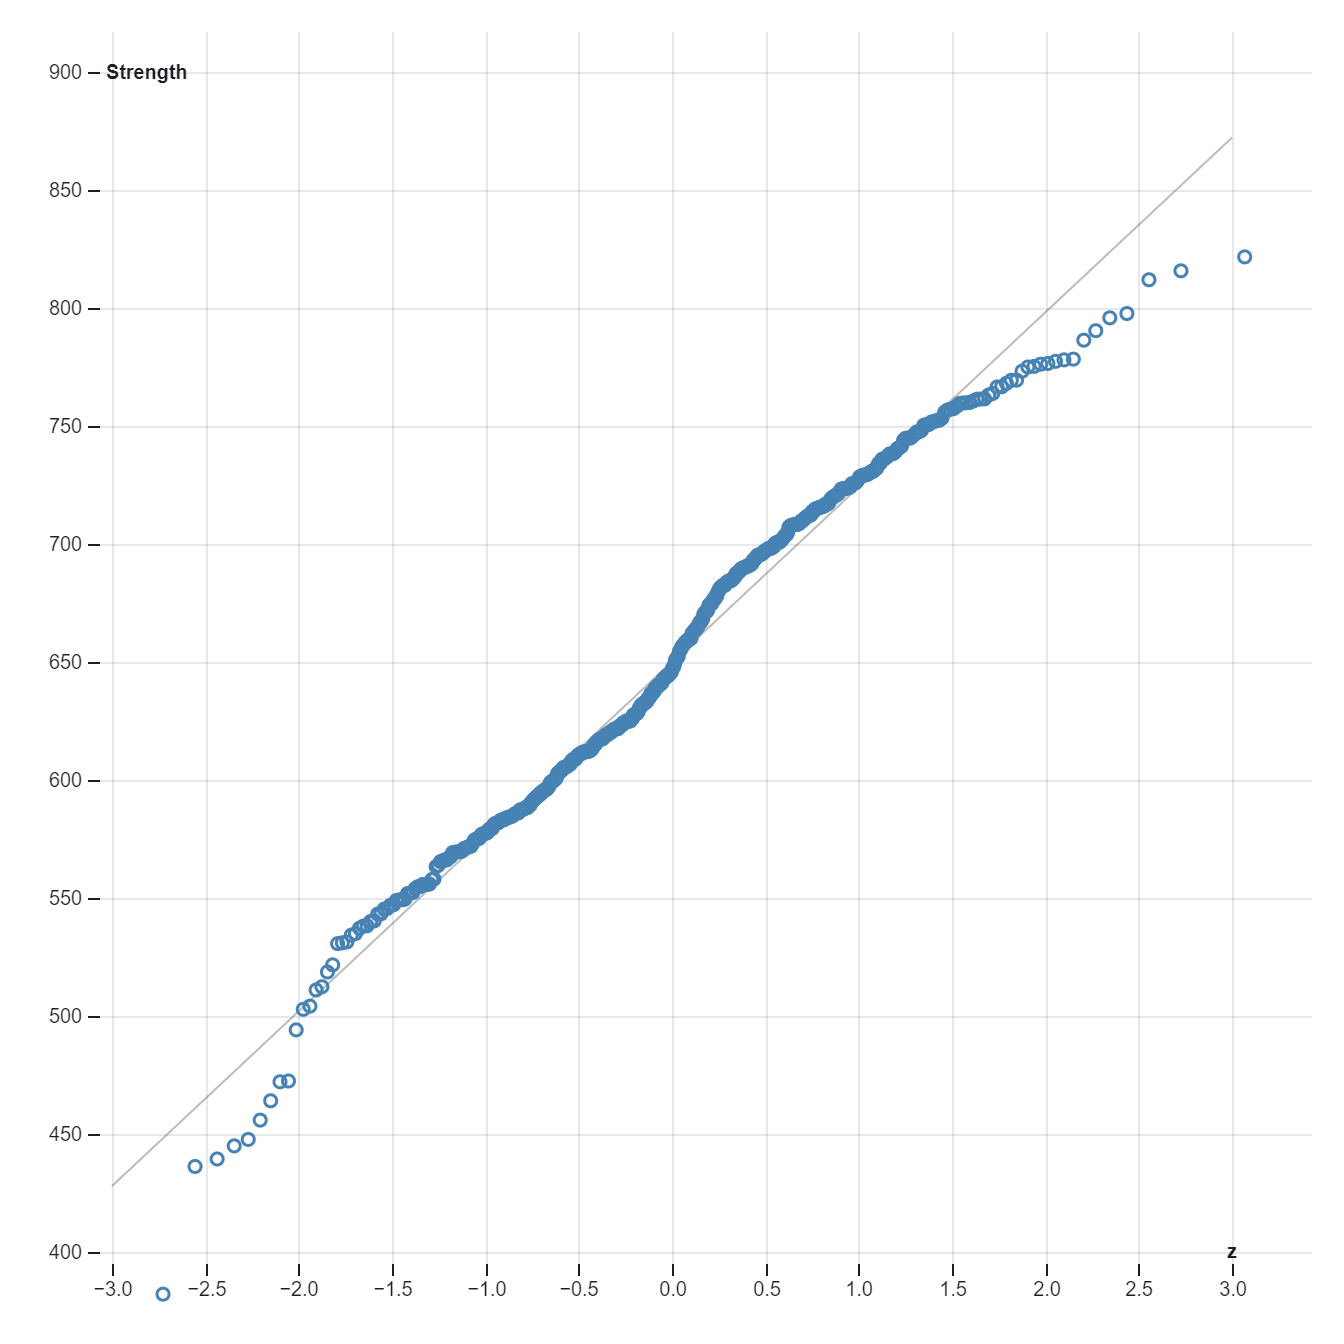
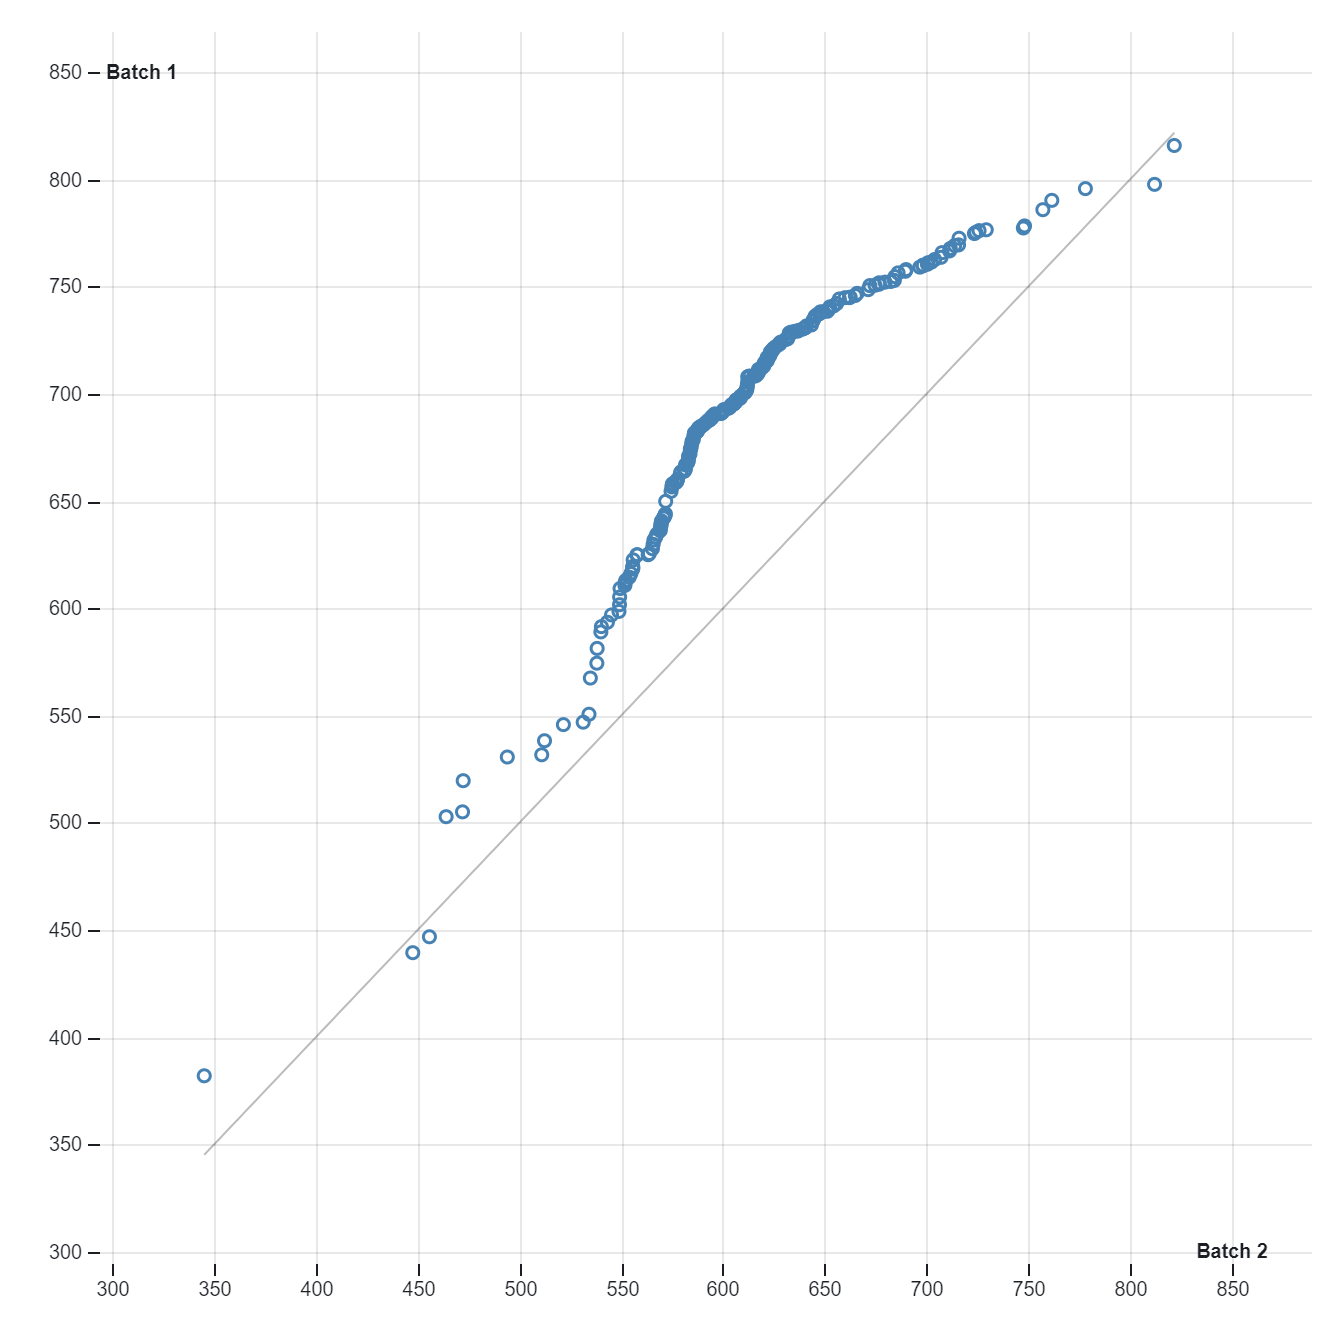
A Q-Q (quantile-quantile) plot, also known as a quantile plot or quantile-quantile plot chart, is a graphical tool used to assess whether a dataset follows a specified distribution, typically a normal distribution. The Q-Q plot compares the quantiles of the dataset against the quantiles of a theoretical distribution, such as the standard normal distribution or any other specified distribution.In a Q-Q plot, the x-axis represents the quantiles of the theoretical distribution, while the y-axis represents the quantiles of the dataset being analyzed. Each data point on the plot corresponds to a pair of values: the observed value from the dataset and its corresponding expected value from the theoretical distribution. If the dataset perfectly follows the theoretical distribution, the points on the Q-Q plot will fall along a straight diagonal line.Deviation from the diagonal line indicates departures from the assumed distribution. For example, if the points on the plot curve upwards or downwards, it suggests that the dataset has heavier or lighter tails, respectively, compared to the theoretical distribution. Similarly, if the points form an S-shaped curve, it indicates skewness in the dataset.Q-Q plots are commonly used in statistics to assess the validity of distributional assumptions underlying statistical analyses. They provide a visual means of checking whether the data follows the expected distribution, aiding in model validation, hypothesis testing, and parameter estimation. Additionally, Q-Q plots are valuable for identifying outliers and detecting departures from distributional assumptions, which can impact the reliability and accuracy of statistical analyses.
Uses:
- Forecasting: Q-Q plots are utilized in time series analysis and forecasting to assess the normality of residuals or forecast errors.
- Distributional Transformation: They help in selecting appropriate distributional transformations to normalize data and improve model performance.
- Variable Screening: Q-Q plots aid in screening variables for their distributional characteristics before inclusion in statistical models.
- Data Mining: They assist in data mining tasks by evaluating the fit of observed data to various theoretical distributions.
- Machine Learning: Q-Q plots are employed in machine learning pipelines to evaluate the distributional assumptions of input features.
- Process Optimization: They support process optimization efforts by ensuring that process outputs adhere to specified distributional requirements.
- Quality Assurance in Manufacturing: Q-Q plots are used in manufacturing industries to verify that product quality metrics follow expected distributions.
- Financial Analysis: They are utilized in finance to assess the distributional properties of financial data and model residuals.
- Survival Analysis: Q-Q plots help in survival analysis by evaluating the fit of survival time distributions to observed data.
- Bayesian Analysis: They aid in Bayesian analysis by assessing the fit of posterior distributions to observed data distributions.
Purposes:
- Robustness Testing: Q-Q plots are used to test the robustness of statistical methods to deviations from distributional assumptions.
- Error Distribution Analysis: They assist in analyzing the distribution of errors or residuals from predictive models.
- Sensitivity Analysis: Q-Q plots support sensitivity analysis by evaluating how changes in model inputs affect the distribution of outputs.
- Forecast Evaluation: They are employed to evaluate the accuracy and reliability of forecasts by assessing the distribution of forecast errors.
- Regression Diagnostics: Q-Q plots aid in regression diagnostics by evaluating the normality of residuals and identifying influential data points.
- Assessment of Data Stability: They support the assessment of data stability over time by comparing Q-Q plots of consecutive datasets.
- Portfolio Risk Assessment: In finance, Q-Q plots help assess the distributional properties of portfolio returns and risks.
- Environmental Monitoring: Q-Q plots are used in environmental monitoring to assess the distribution of pollutant concentrations.
- Biomedical Research: They aid in biomedical research by evaluating the distributional properties of biological data and model residuals.
- Process Capability Analysis: Q-Q plots support process capability analysis by evaluating the distribution of process output variables against specifications.
Only logged in customers who have purchased this product may leave a review.
Related products
-
- Sale!
Sunburst
- Original price was: $ 15.$ 10Current price is: $ 10.
- Add to cart
-
- Sale!
Volcano Contours
- Original price was: $ 15.$ 10Current price is: $ 10.
- Add to cart
-
- Sale!
Tidy Tree
- Original price was: $ 15.$ 10Current price is: $ 10.
- Add to cart
Reviews
There are no reviews yet.