Sale!
Description
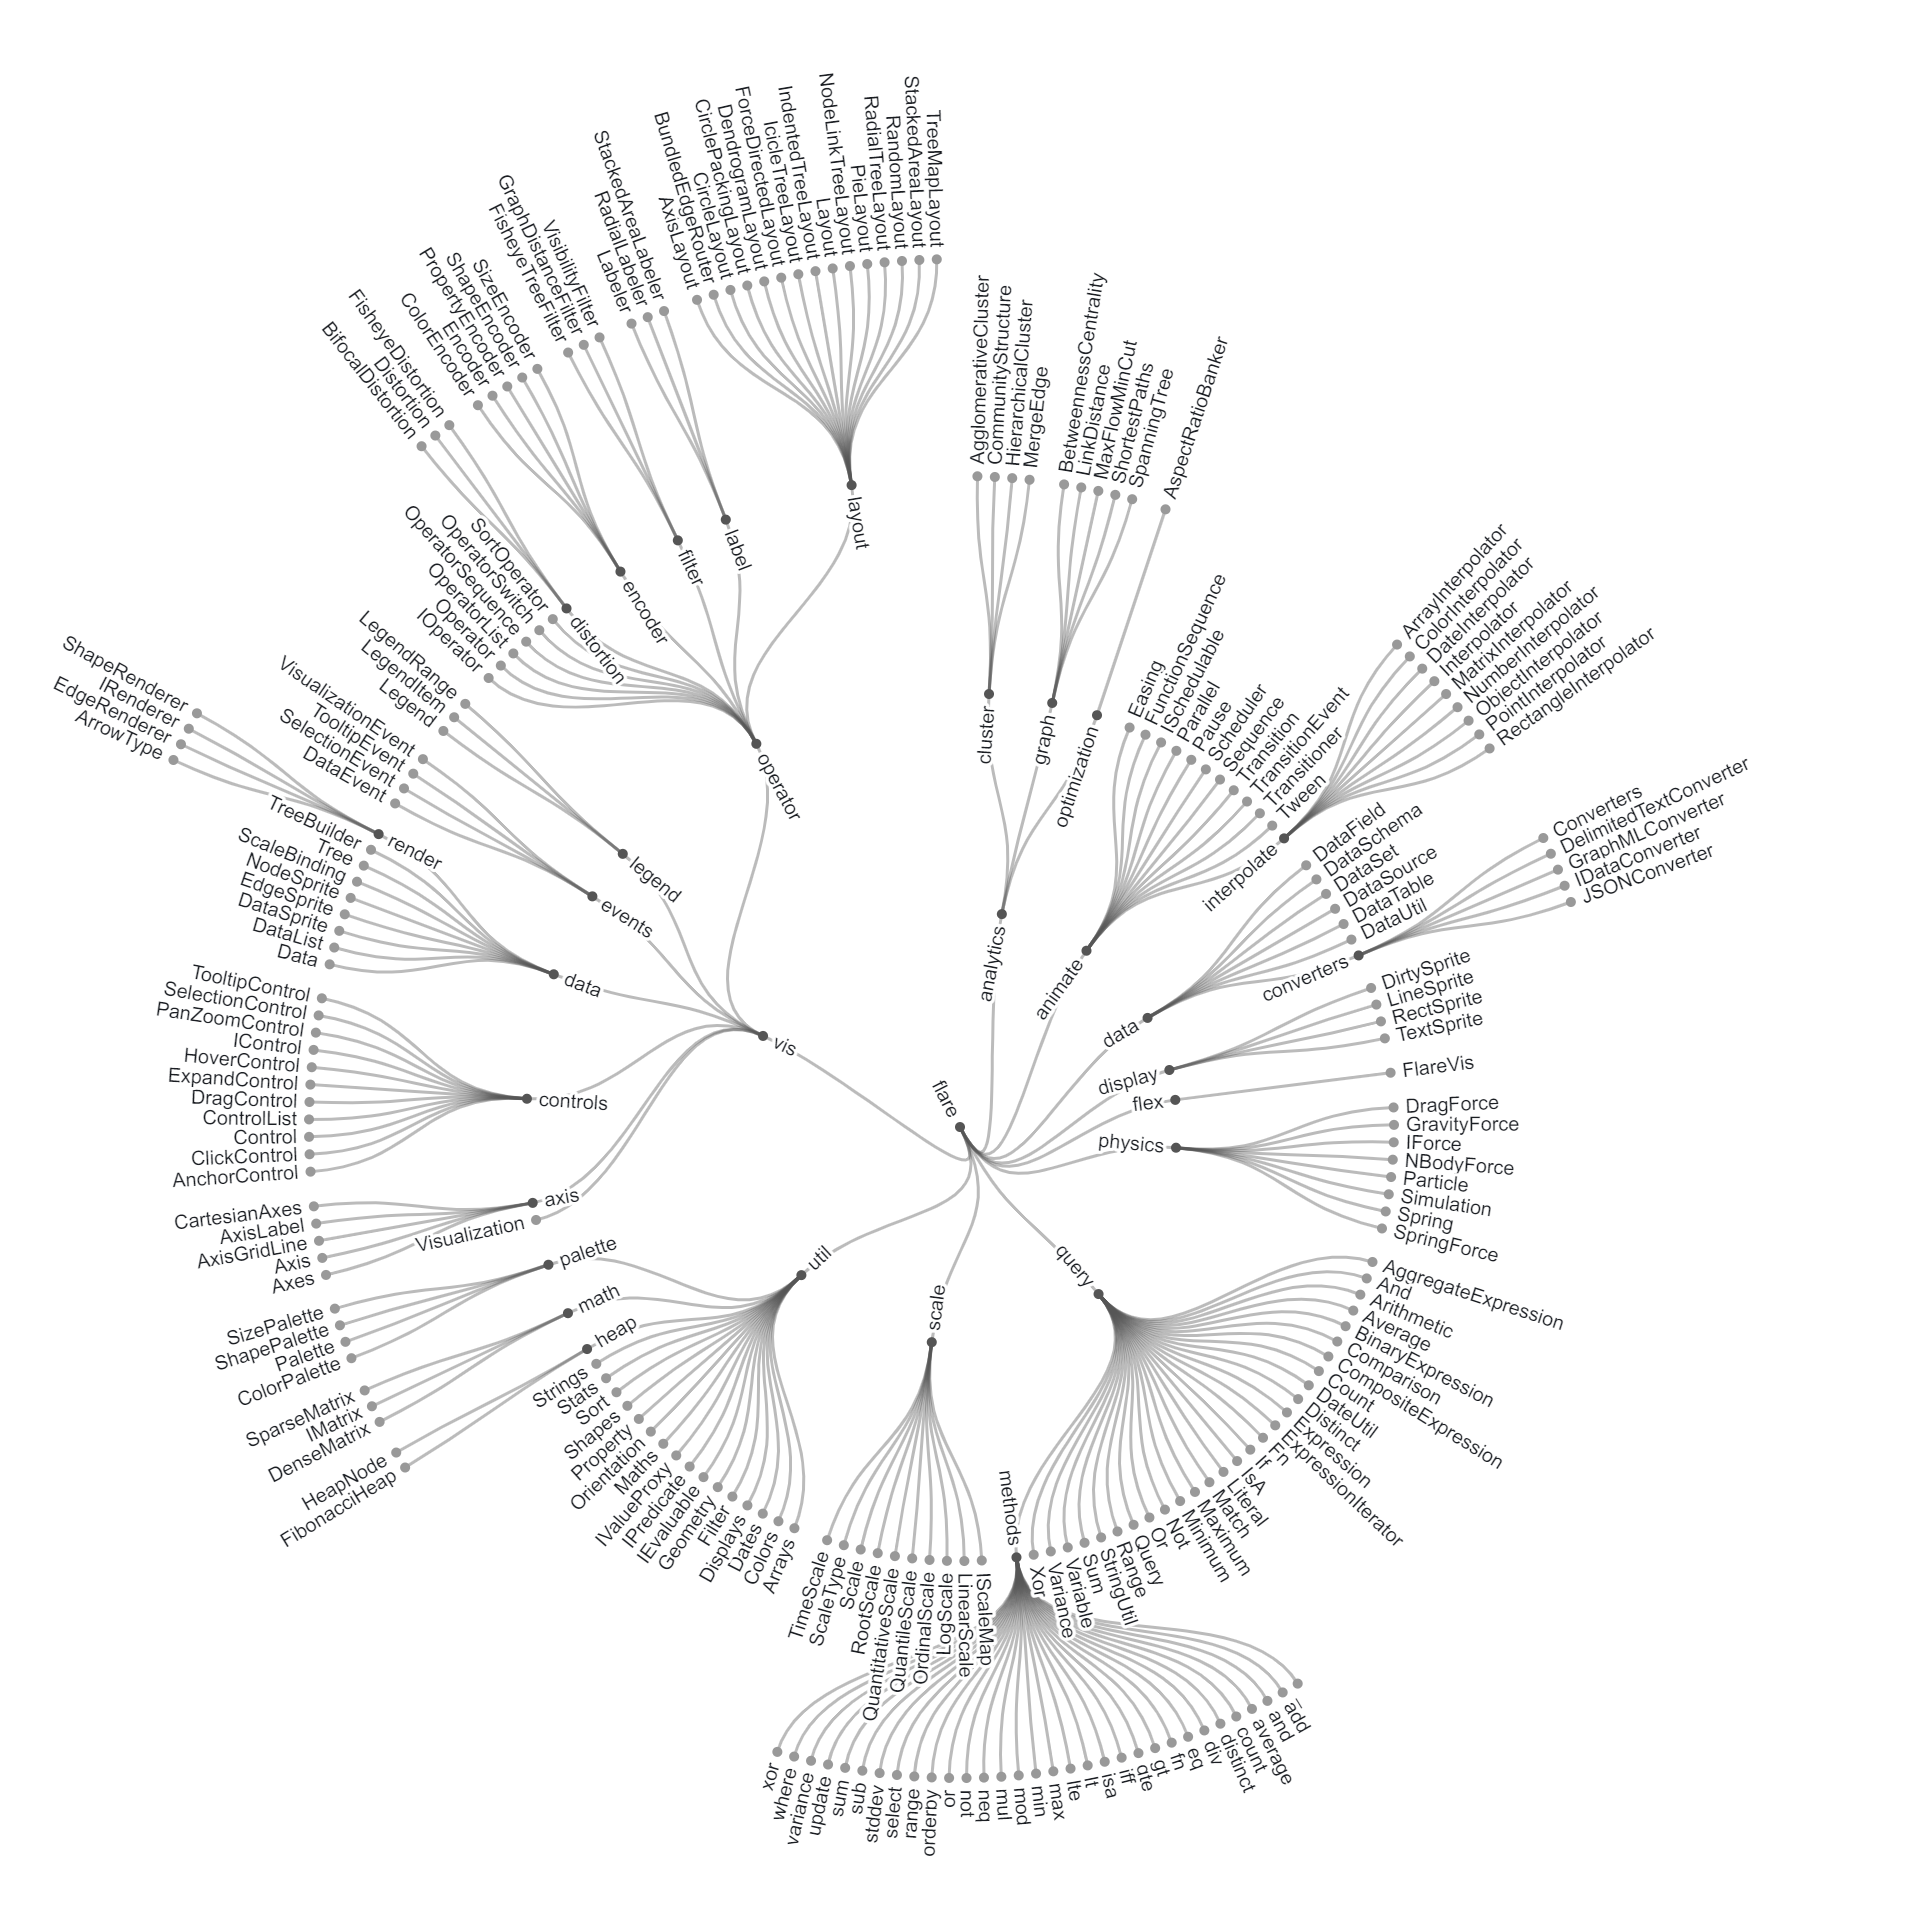
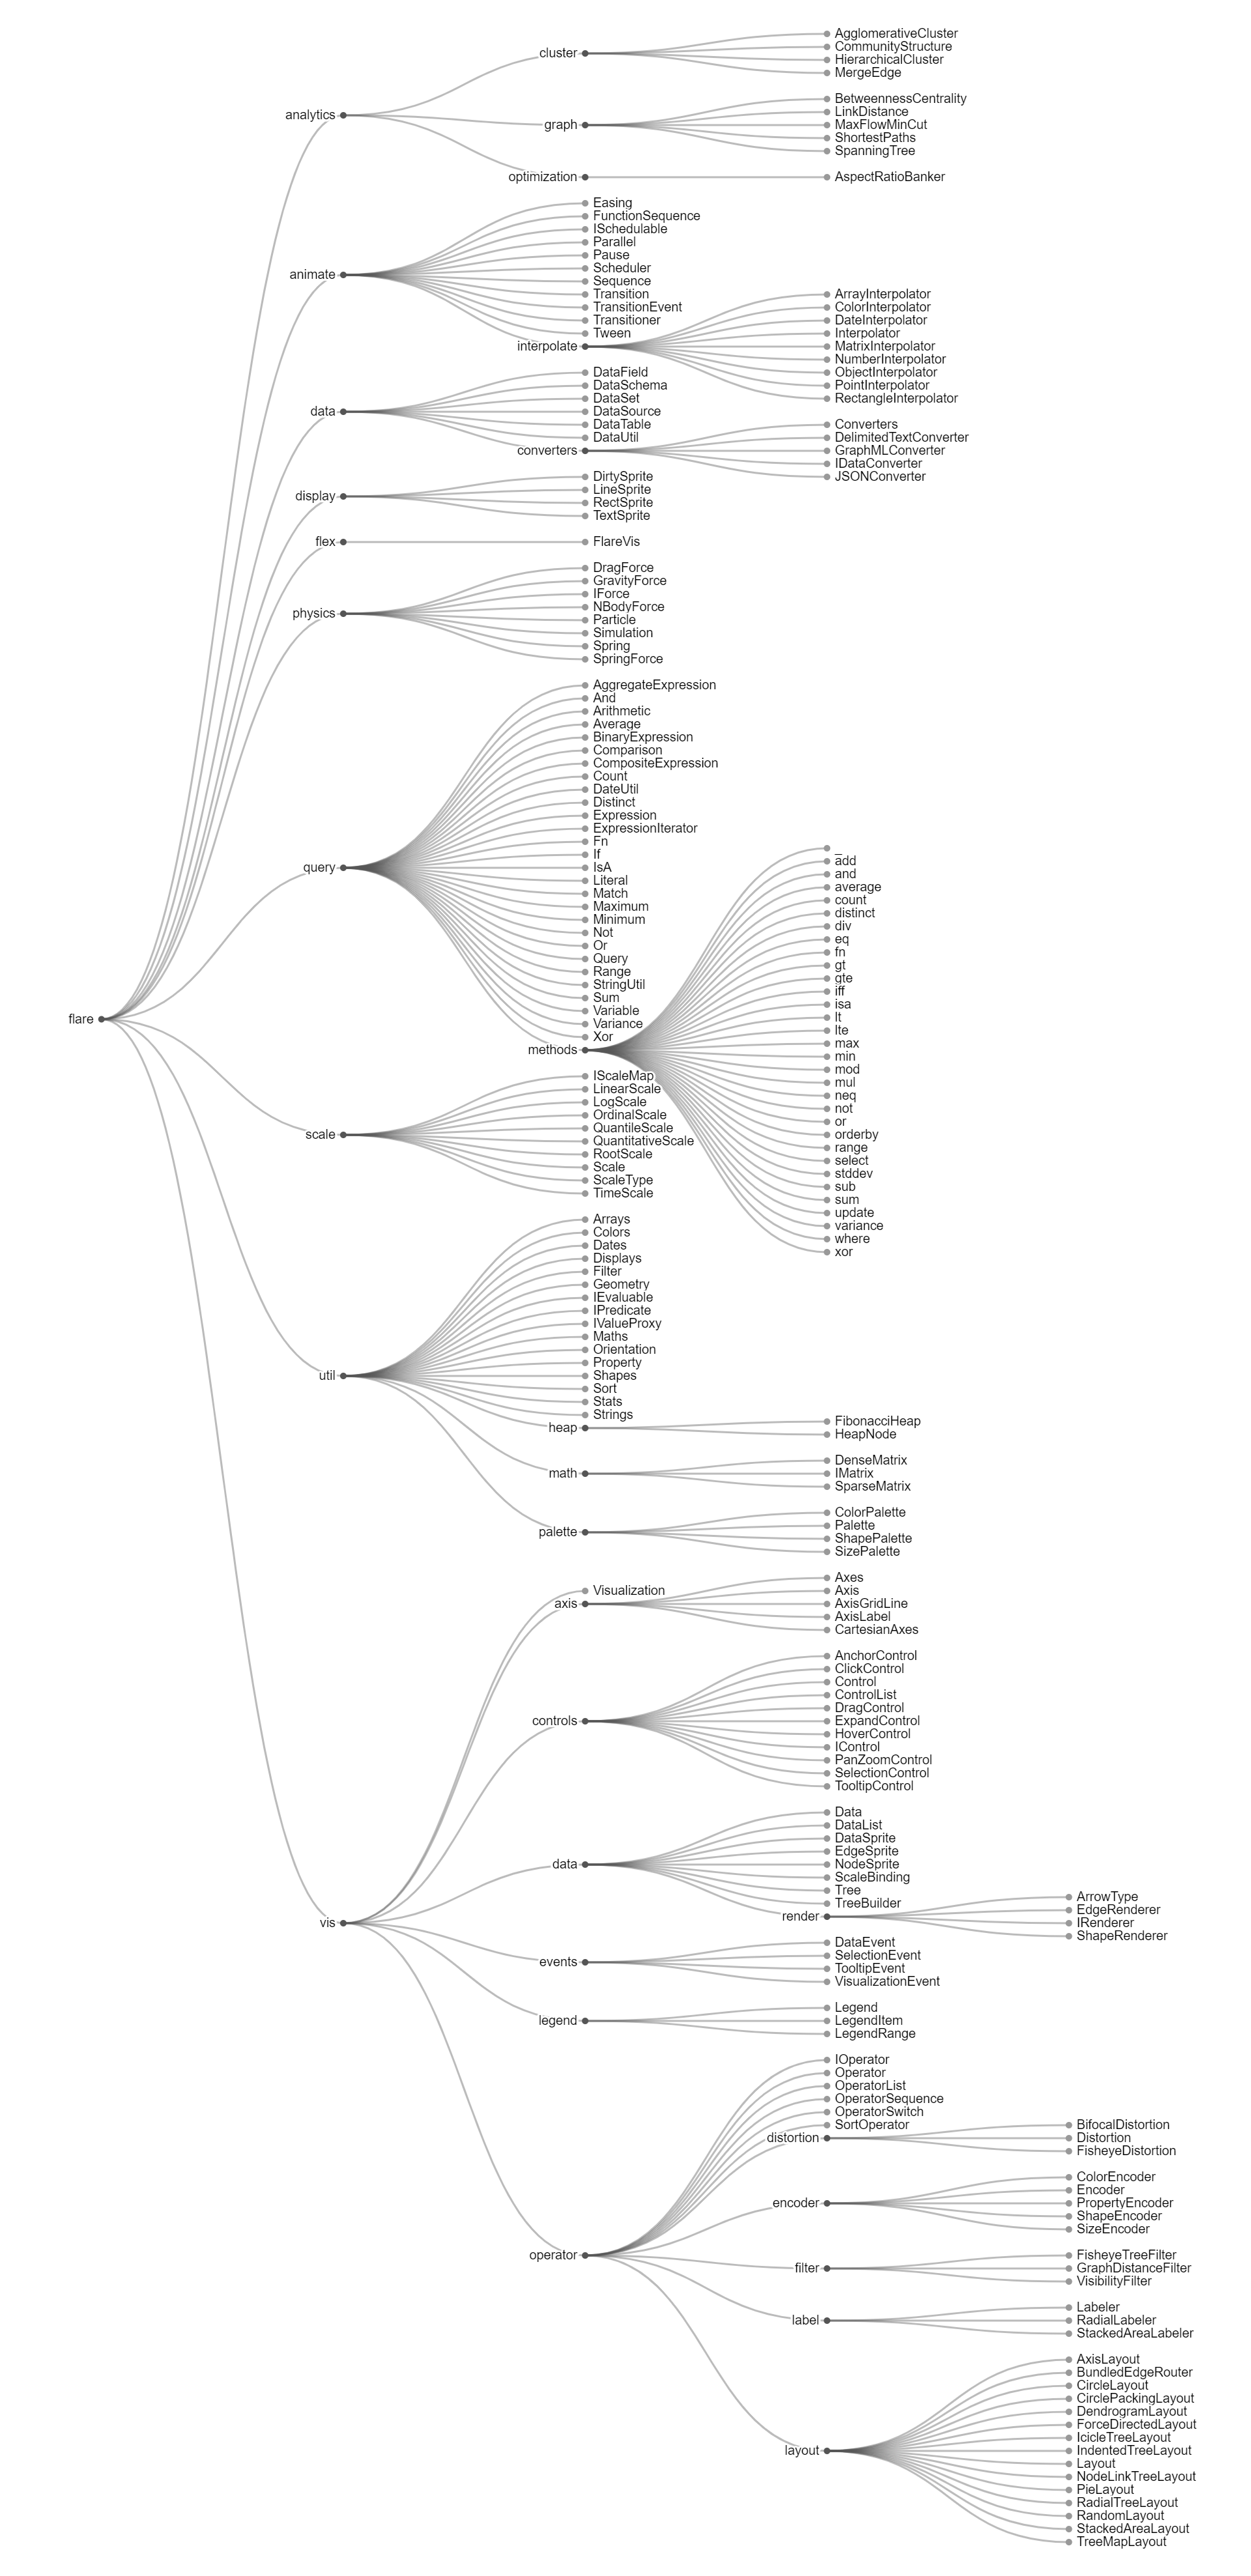
Tidy Tree charts are an innovative and structured method of visualizing hierarchical data, presenting it in a compact and organized layout. Unlike traditional tree diagrams that may spread out extensively, Tidy Trees maintain a tidy and space-efficient structure. Each node in the hierarchy is neatly arranged in a horizontal or vertical fashion, with parent nodes positioned above or to the left of their respective child nodes. This layout minimizes overlaps and ensures that the connections between nodes are clear and easily understandable. Tidy Trees are characterized by their simplicity and clarity, making them particularly effective for visualizing complex hierarchical structures in a concise and intuitive manner.
Uses:
Uses:
- File System Navigation: Tidy Tree charts are useful for visualizing the hierarchical structure of file systems, aiding in navigation and organization of directories, subdirectories, and files.
- Codebase Analysis: They facilitate the exploration and understanding of codebases by visualizing the hierarchical relationships between classes, functions, and modules.
- Conceptual Mapping: Tidy Tree charts help in organizing and mapping out complex ideas, concepts, and relationships, providing a structured visual representation for brainstorming sessions and knowledge organization.
- Version Control Visualization: They aid in understanding version control systems such as Git, by visualizing branches, commits, and merges in software development projects.
- Workflow Diagrams: Tidy Tree charts can be used to represent workflow processes, task dependencies, and project timelines, aiding in project management and process optimization.
- Organization Charts: They serve as effective tools for visualizing organizational structures, team hierarchies, and reporting relationships within businesses and institutions.
- Course Curriculum Planning: Tidy Tree charts help educators in planning course curriculums by organizing topics, subtopics, and learning objectives hierarchically.
- Biological Taxonomies: They are useful for visualizing biological classifications and taxonomies, such as species hierarchies, phylogenetic trees, and evolutionary relationships.
- Issue Tracking: Tidy Tree charts assist in visualizing issue tracking systems, by representing the hierarchy of issues, tasks, and subtasks within a project.
- Document Outlines: They are employed to create outlines for documents, articles, or reports, organizing sections, subsections, and paragraphs hierarchically for better structuring and readability.
Purposes:
- Structured Visualization: Tidy Tree charts provide a structured and organized visualization of hierarchical data, aiding in comprehension and analysis.
- Simplicity and Clarity: They offer a clear and concise representation of complex hierarchical structures, making it easier to understand relationships and dependencies.
- Navigational Aid: Tidy Tree charts serve as navigational aids for exploring hierarchical data, enabling users to navigate through levels and branches efficiently.
- Comparison and Analysis: They facilitate comparison and analysis of different hierarchical structures or datasets, allowing users to identify patterns, trends, and anomalies.
- Decision Support: Tidy Tree charts provide insights to support decision-making processes related to resource allocation, planning, and organizational design.
- Communication Tool: They serve as effective communication tools for presenting complex hierarchical data to stakeholders, clients, or colleagues in a clear and understandable manner.
- Educational Resource: Tidy Tree charts are valuable educational resources for teaching hierarchical concepts and structures in subjects such as biology, computer science, and organizational theory.
- Collaboration Aid: They facilitate collaboration and teamwork by providing a shared understanding of hierarchical structures and relationships within datasets or projects.
- Visualization Tool: Tidy Tree charts serve as visualization tools for presenting hierarchical data structures in a visually intuitive and interpretable format.
- Knowledge Discovery: They support knowledge discovery by revealing insights, relationships, or clusters within complex hierarchical datasets through visual exploration and analysis.
Only logged in customers who have purchased this product may leave a review.
Related products
-
- Sale!
Box plot
-
$ 15Original price was: $ 15.$ 10Current price is: $ 10. - Add to cart
-
- Sale!
-
$ 15Original price was: $ 15.$ 10Current price is: $ 10. - Add to cart
-
- Sale!
Normal Quantile Plot
-
$ 15Original price was: $ 15.$ 10Current price is: $ 10. - Add to cart


Reviews
There are no reviews yet.