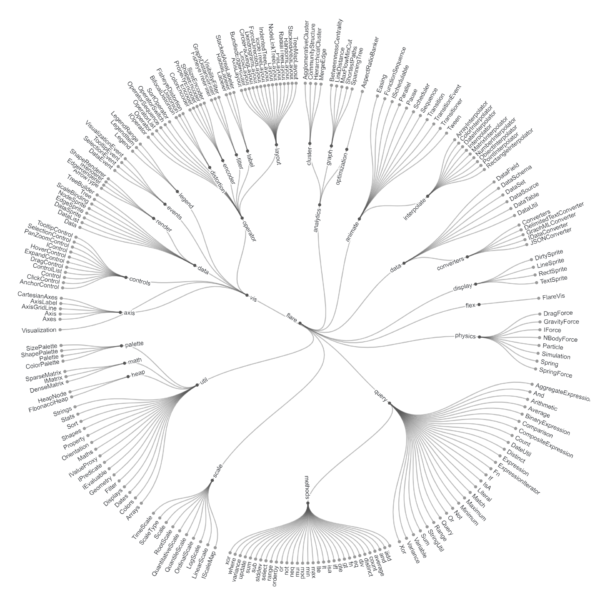
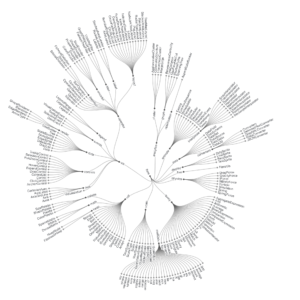
The Radial Cluster Tree chart is a distinctive data visualization tool that presents hierarchical relationships in a circular layout, with nodes arranged radially around a central point. Unlike traditional hierarchical tree structures that typically display nodes in a linear or hierarchical manner, the Radial Cluster Tree chart arranges nodes in a circular pattern, radiating outwards from the center. Each node in the hierarchy is represented by a circle or segment, with the size and position of the circles indicating their hierarchical level and relationship to other nodes. Nodes at deeper levels of the hierarchy are positioned farther from the center, creating concentric circles that represent different levels of the hierarchy. The hierarchical relationships between nodes are depicted by connecting lines or curves, with parent nodes linked to their child nodes through radial spokes. This radial layout allows for a compact and visually appealing representation of hierarchical data, making it easier to identify patterns, clusters, and relationships within the dataset. The Radial Cluster Tree chart is particularly useful for visualizing hierarchical data with multiple levels of nesting, such as organizational structures, genealogical relationships, or hierarchical classifications. It provides an intuitive and efficient way to explore and analyze complex hierarchical datasets, offering a unique perspective that differs from traditional linear or hierarchical tree layouts.
Uses:
- Genealogical Research: Visualizing family trees and ancestral relationships in genealogy research, providing a holistic view of familial connections and lineages.
- Historical Timeline: Representing historical events and their chronological relationships in a circular format, allowing for a comprehensive overview of historical timelines and epochs.
- Mind Mapping: Creating radial mind maps to organize and visualize ideas, concepts, and relationships in brainstorming sessions, creative thinking, or problem-solving activities.
- Product Taxonomy: Mapping product hierarchies and classifications in e-commerce platforms, helping users navigate product categories, attributes, and variations.
- Workflow Visualization: Visualizing workflow processes, task dependencies, and project timelines in project management and process optimization, enabling stakeholders to understand project progress and resource allocation.
- Biology and Ecology: Analyzing biological systems, ecological networks, and species interactions in biology and ecology research, providing insights into ecosystems, food webs, and biodiversity.
- Geographical Mapping: Mapping geographical data, such as geographic regions, terrain features, or climate zones, in a radial layout for spatial analysis and visualization.
- Organizational Dynamics: Visualizing organizational structures, team dynamics, and communication networks in businesses and institutions, aiding in organizational planning, restructuring, and team building.
- Network Visualization: Visualizing network structures, social relationships, and communication patterns in social network analysis, enabling researchers to identify communities, influencers, and information flow.
- Educational Tools: Creating interactive educational tools and visual aids for teaching subjects such as history, biology, geography, or organizational behavior, providing students with engaging and informative learning experiences.
Purposes:
- Holistic Visualization: Providing a holistic and comprehensive visualization of hierarchical data, allowing users to see the entire dataset at a glance.
- Spatial Representation: Representing spatial relationships and distributions in a circular format, offering a unique perspective on geographical, biological, or network data.
- Conceptual Mapping: Mapping complex ideas, concepts, and relationships in a radial layout, fostering creative thinking, problem-solving, and knowledge discovery.
- Interactive Exploration: Enabling interactive exploration and navigation of hierarchical datasets, allowing users to zoom in, zoom out, and interact with individual nodes and clusters.
- Pattern Identification: Facilitating the identification of patterns, clusters, and trends within hierarchical datasets, aiding in data analysis and insight generation.
- Comparative Analysis: Supporting comparative analysis of different hierarchical structures or datasets, allowing users to compare patterns, distributions, and relationships.
- Communication Aid: Serving as a visual communication aid for presenting complex hierarchical data to stakeholders, clients, or colleagues, enhancing understanding and decision-making.
- Storytelling Tool: Using radial layouts to create engaging and interactive storytelling experiences, presenting narratives, timelines, and historical events in a visually compelling format.
- Dynamic Visualization: Creating dynamic and interactive visualizations that respond to user inputs and interactions, providing a customizable and engaging user experience.
- Creative Expression: Allowing for creative expression and artistic visualization of hierarchical data, combining aesthetics with functionality to create visually appealing and informative charts.

Reviews
There are no reviews yet.