Description
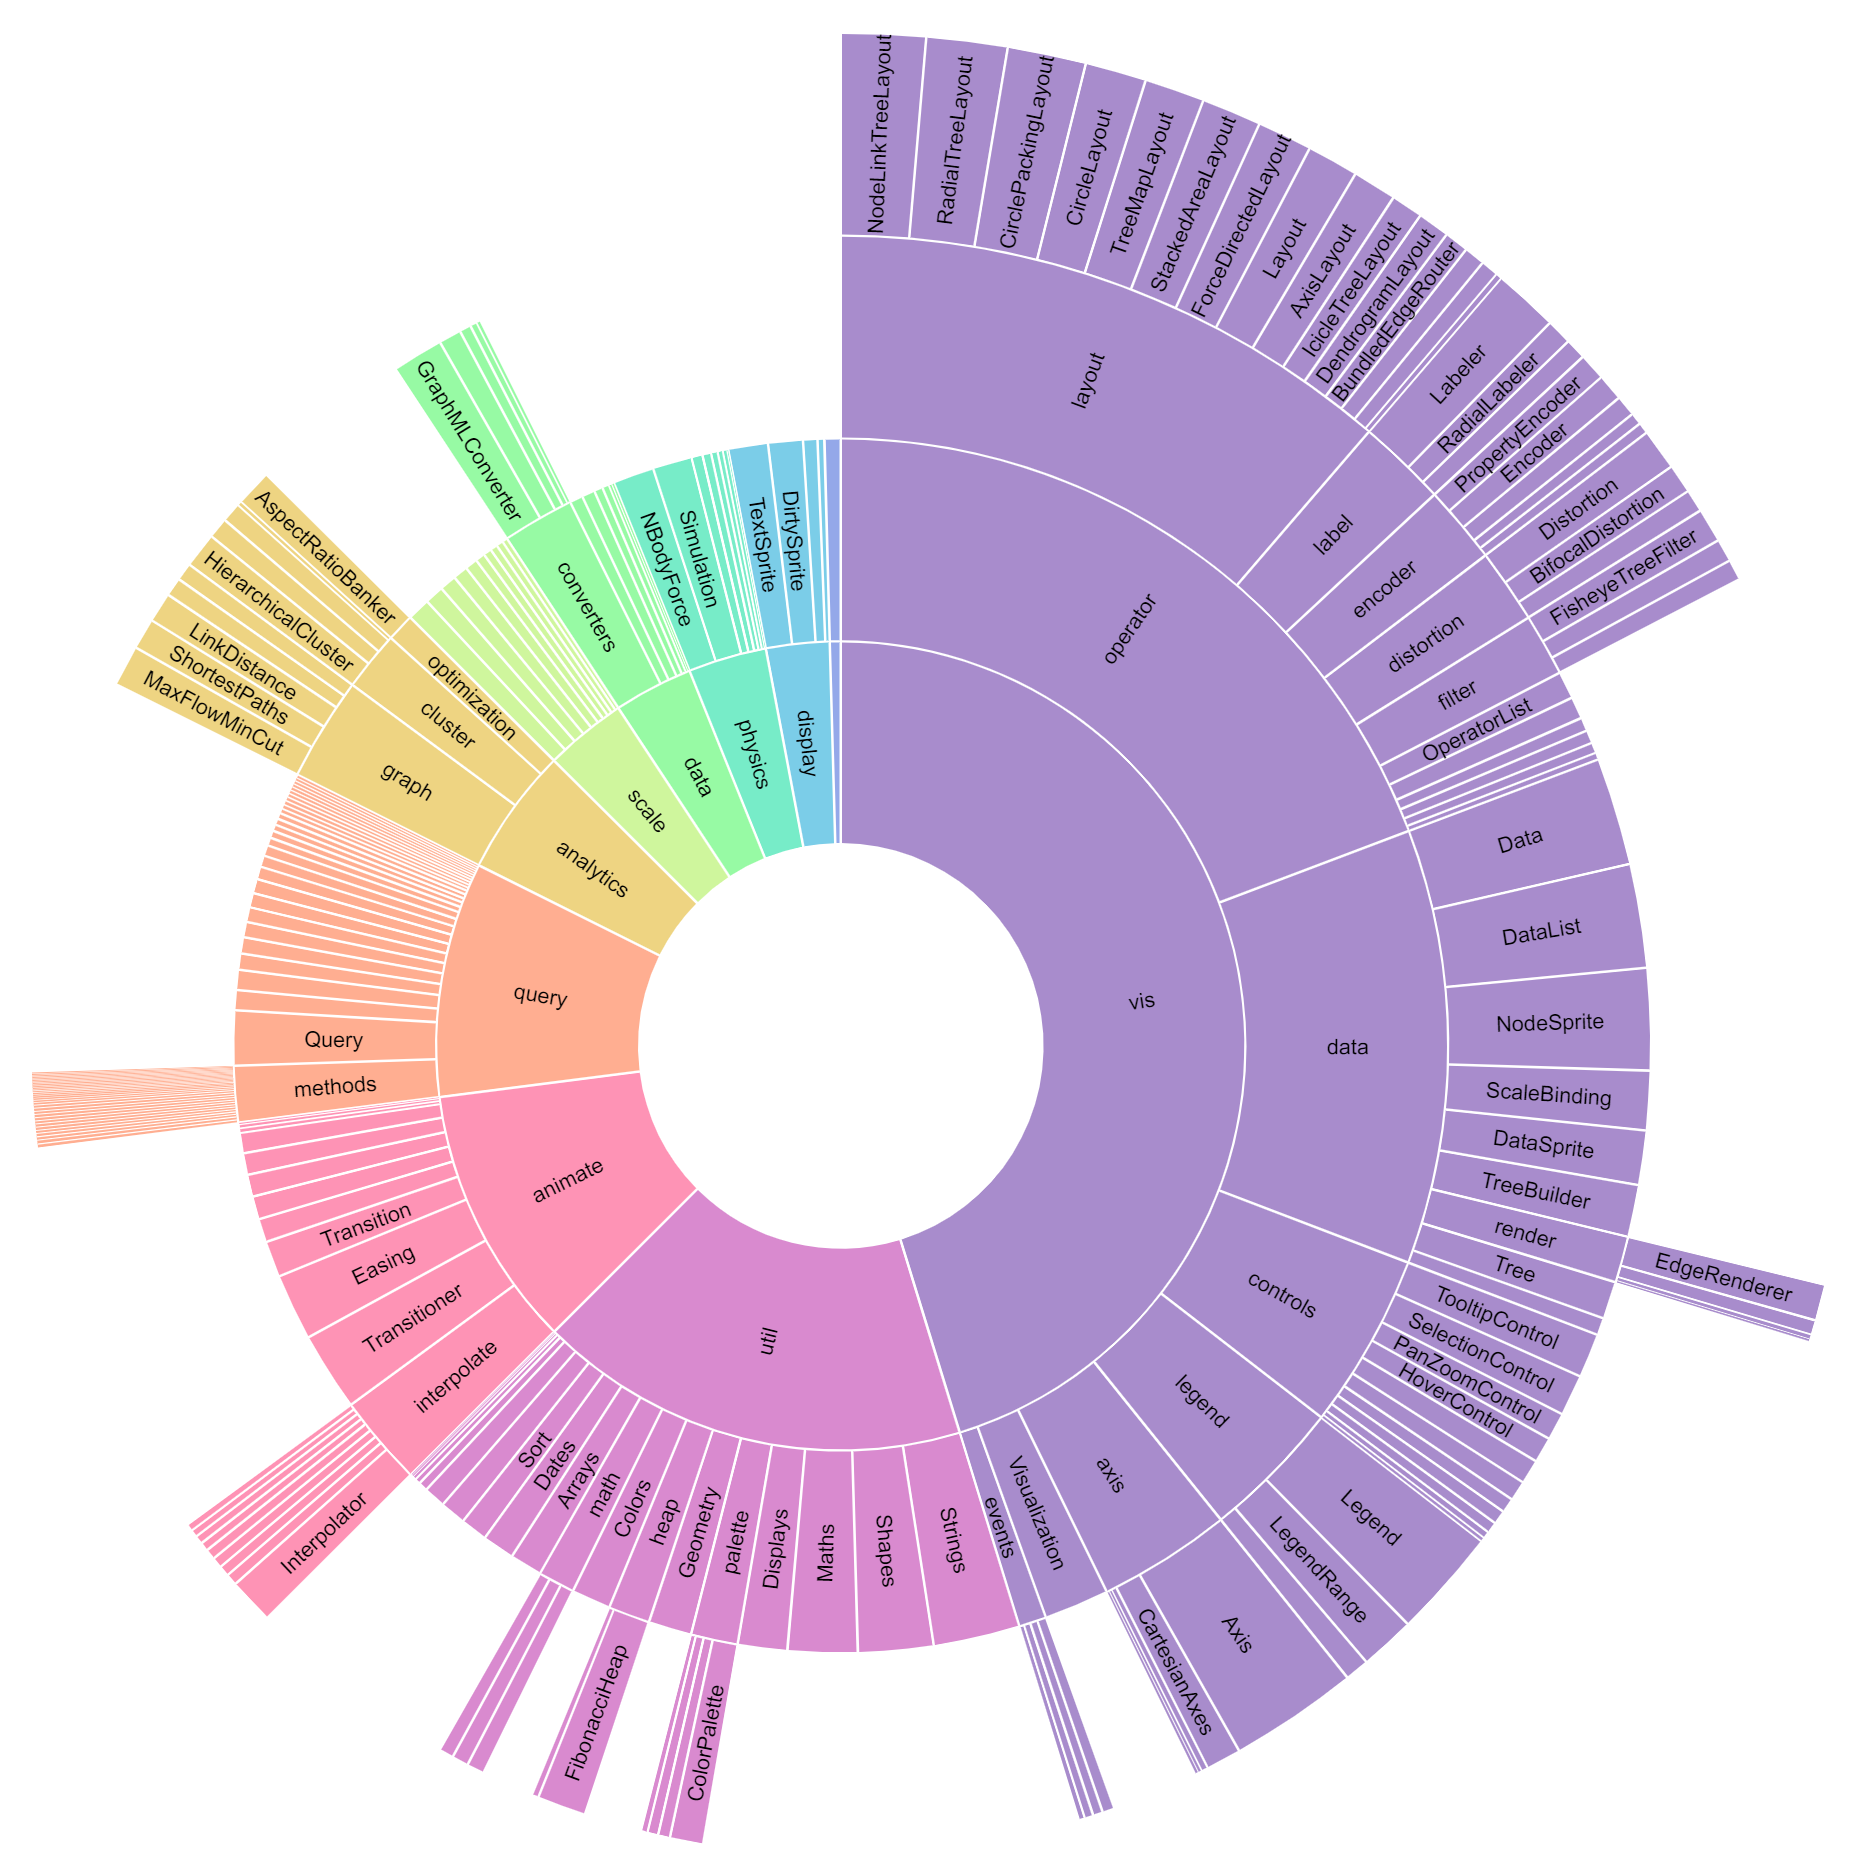
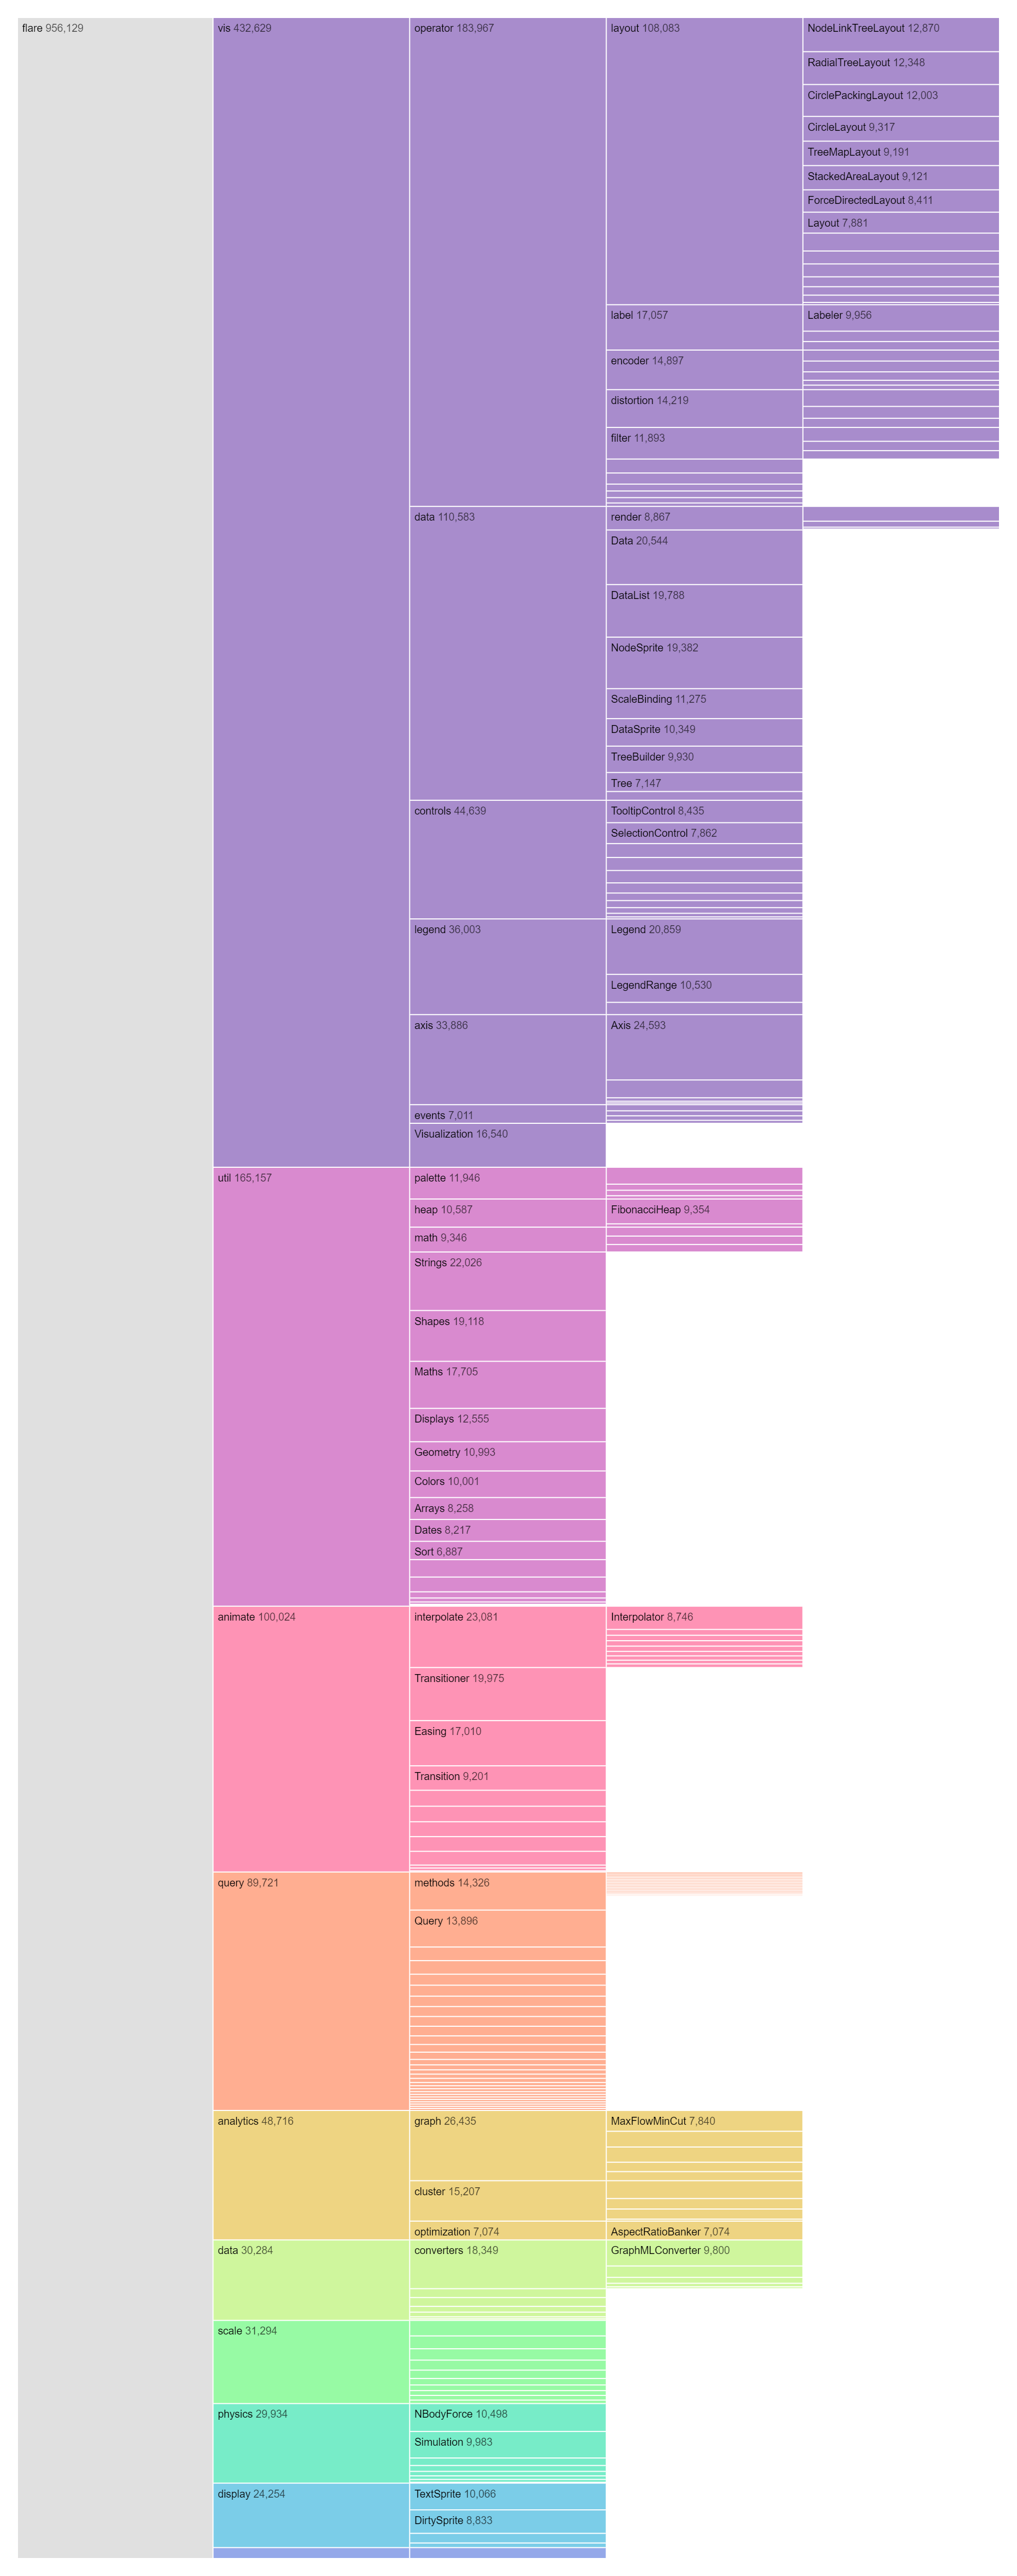
An Icicle Chart, also known as a Sunburst Chart, is a hierarchical data visualization tool that displays nested rectangles or segments to represent hierarchical data structures. In this chart, each rectangle or segment represents a node in the hierarchy, with the size or length of the rectangle indicating the quantitative value associated with that node. The hierarchy is depicted by the nesting of rectangles within one another, with each level of the hierarchy represented by a different layer or level of rectangles. Typically, the root node of the hierarchy is represented by the largest rectangle at the center or top of the chart, and child nodes are represented by smaller rectangles nested within their parent nodes. The color of each rectangle may also encode additional information, such as category or value, to provide further insights into the data. Icicle Charts are useful for visualizing hierarchical relationships and analyzing the distribution of values within a hierarchy. They provide an intuitive representation of complex hierarchical structures, allowing users to quickly grasp the relative sizes and relationships between different nodes in the hierarchy. Additionally, Icicle Charts can be interactive, allowing users to explore and interact with the hierarchical data by zooming in or clicking on individual rectangles to reveal more detailed information. These charts are commonly used in fields such as data analysis, biology, and finance, where hierarchical relationships are prevalent and understanding the structure of the data is essential for analysis and decision-making.
Uses:
- Hierarchical Data Visualization: Icicle charts are primarily used to visualize hierarchical data structures, representing nodes as nested rectangles or segments.
- Organizational Structure: They help visualize hierarchical organizational structures, including departments, teams, and reporting relationships.
- File System Navigation: Icicle charts aid in navigating file systems by visualizing directory structures and file hierarchies.
- Website Structure: They are used in web design to visualize website structures, including page hierarchies, categories, and subpages.
- Taxonomy Visualization: Icicle charts assist in visualizing taxonomies, classifications, or ontologies by representing hierarchical relationships between categories or concepts.
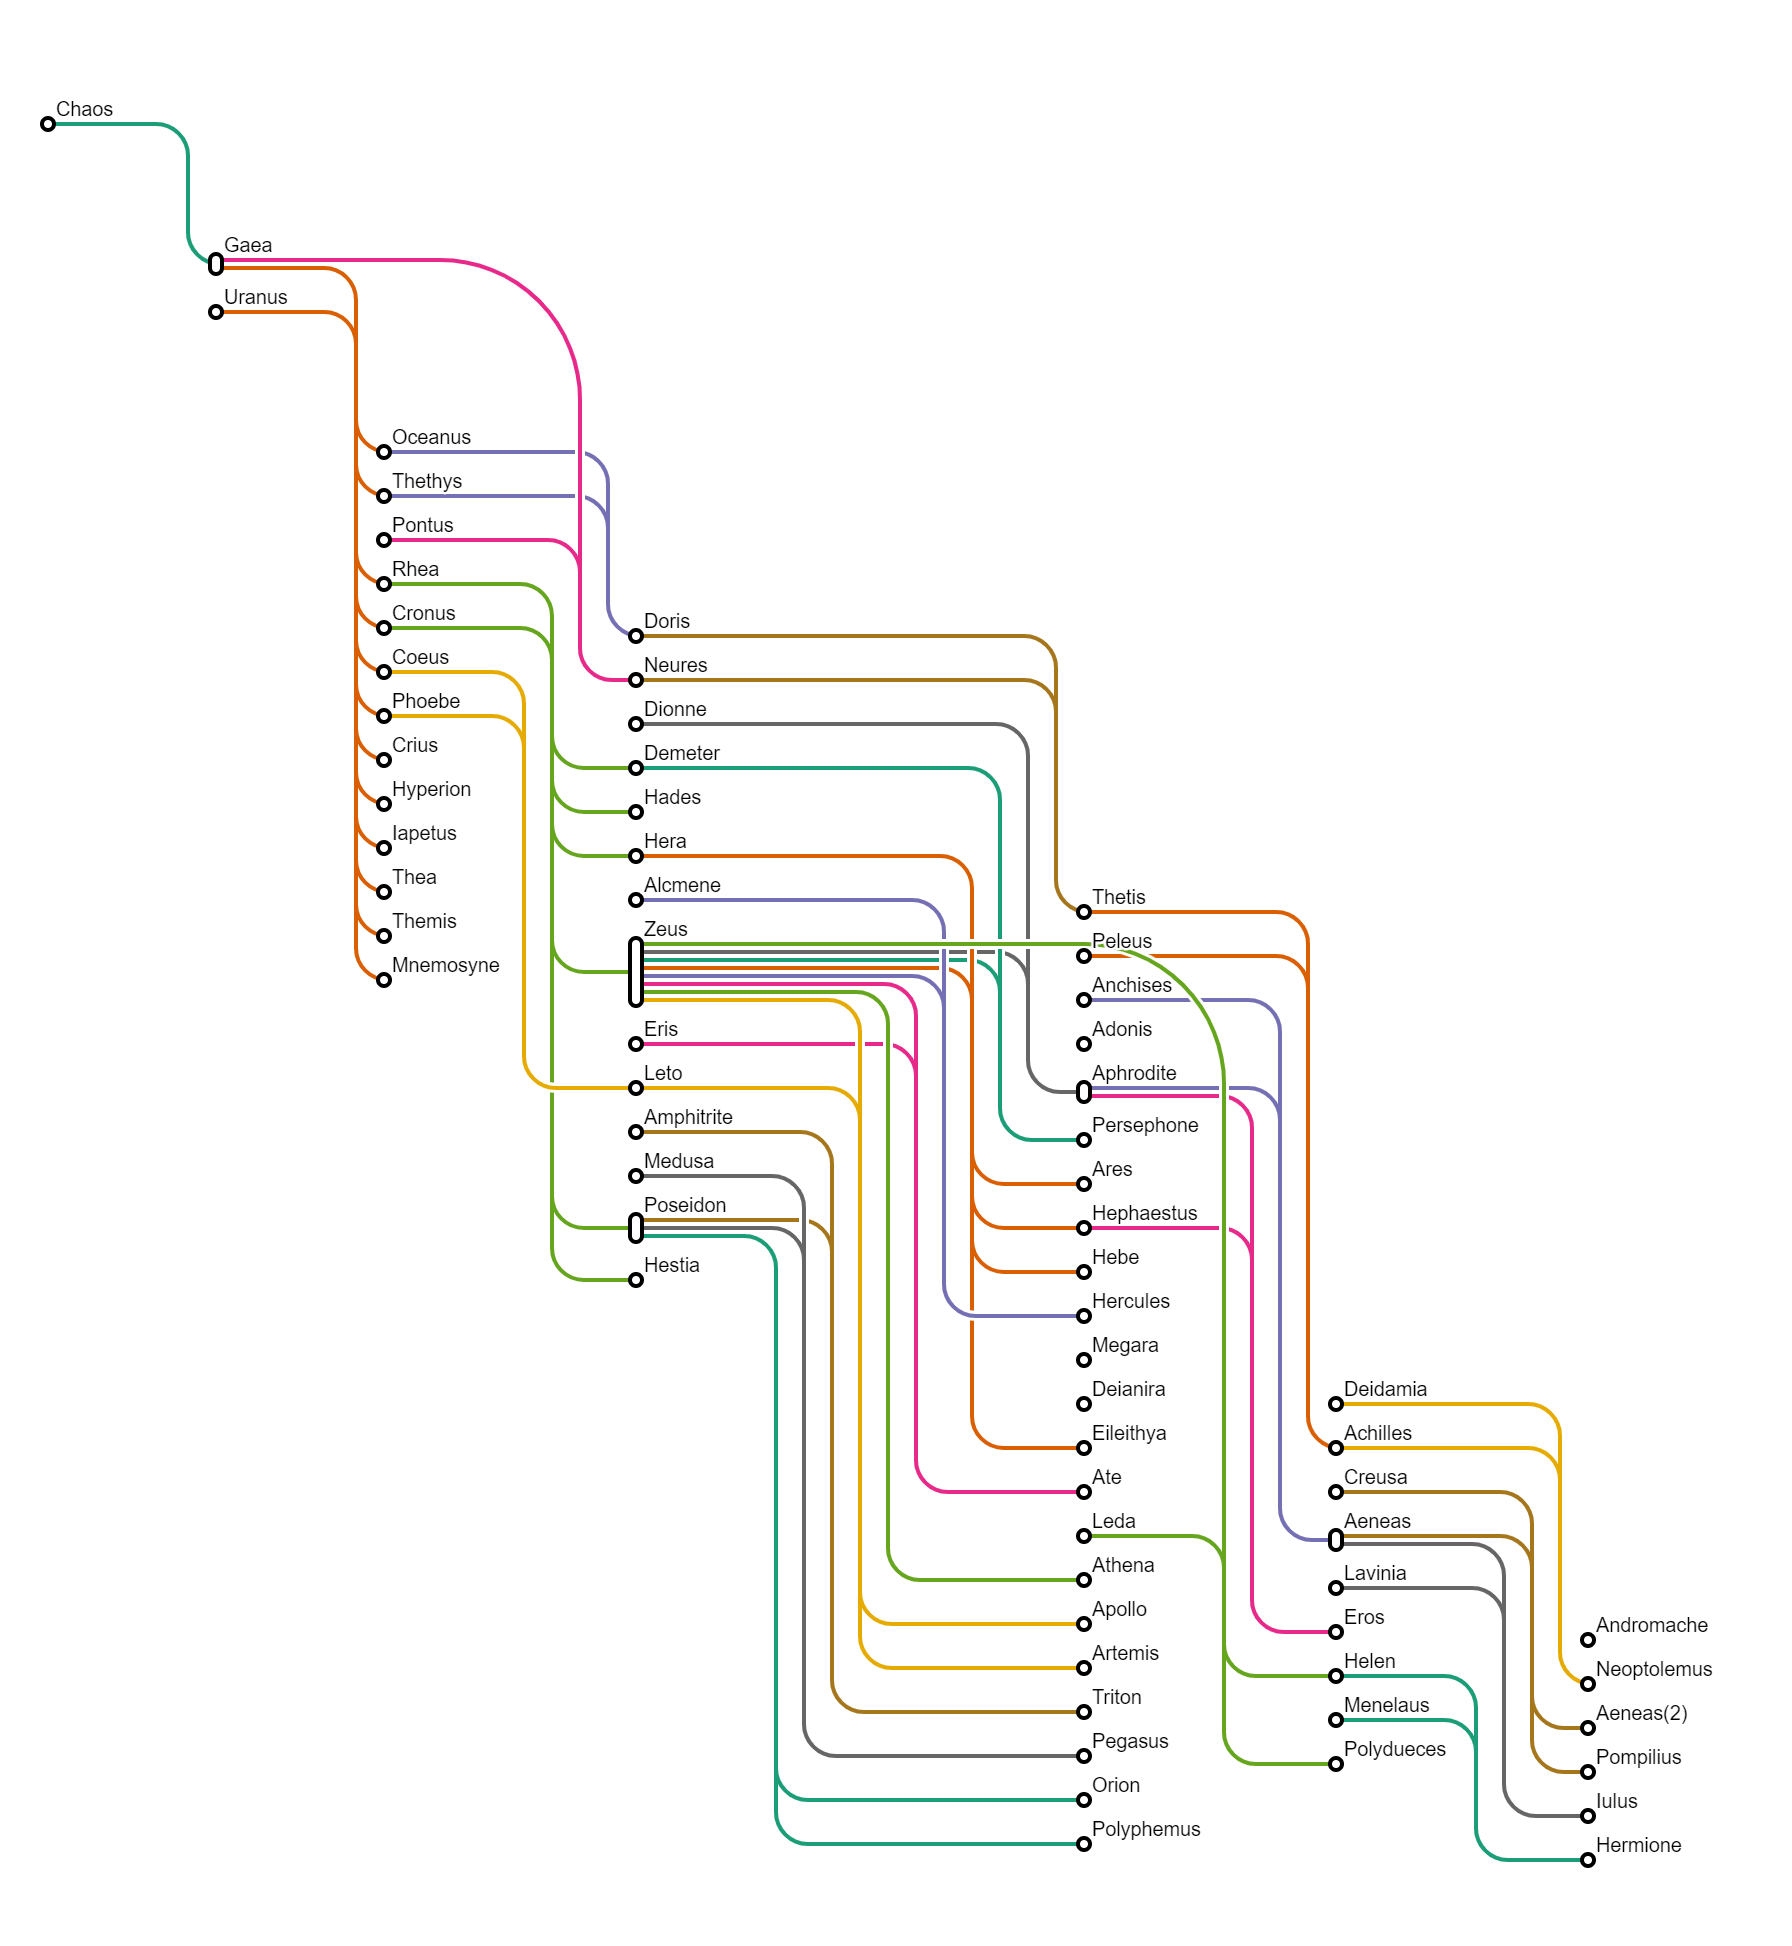
- Family Tree Visualization: They are employed in genealogy to visualize family trees, ancestry, and relationships between individuals.
- Project Management: Icicle charts help visualize project structures, work breakdown structures, and task hierarchies in project management.
- Product Catalog Navigation: They aid in navigating product catalogs by visualizing product categories, subcategories, and product hierarchies.
- Process Mapping: Icicle charts are used in process mapping to visualize process flows, workflows, and process hierarchies.
- Data Exploration: They support data exploration by enabling users to interactively explore hierarchical data structures and relationships.
Purposes:
- Hierarchical Visualization: The primary purpose of Icicle charts is to visualize hierarchical relationships and structures in data.
- Data Analysis: They facilitate data analysis by providing insights into the hierarchical distribution of values within a dataset.
- Pattern Recognition: Icicle charts help identify patterns, trends, or anomalies within hierarchical data sets.
- Comparison: They facilitate comparison of different hierarchical structures or categories by visualizing their relative sizes and relationships.
- Classification: Icicle charts aid in classifying data points or categories into hierarchical groups or clusters.
- Decision Support: They provide insights to support decision-making processes related to resource allocation, planning, or organizational design.
- Knowledge Discovery: Icicle charts facilitate knowledge discovery by revealing insights, relationships, or clusters within complex hierarchical data sets.
- Visualization: They serve as visualization tools for presenting hierarchical data structures in a visually intuitive and interpretable format.
- Interactive Exploration: Icicle charts allow users to interactively explore hierarchical data structures by zooming in, clicking on individual segments, or expanding/collapsing levels of the hierarchy.
- Communication: They serve as communication tools for presenting complex hierarchical data structures to stakeholders, clients, or colleagues in a clear and understandable manner.
Only logged in customers who have purchased this product may leave a review.
Related products
-
- Sale!
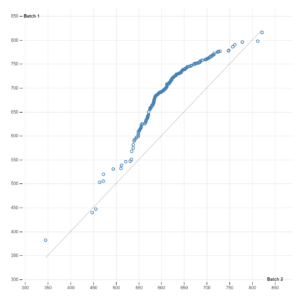
Q-Q Plot
- Original price was: $ 15.$ 10Current price is: $ 10.
- Add to cart
-
- Sale!
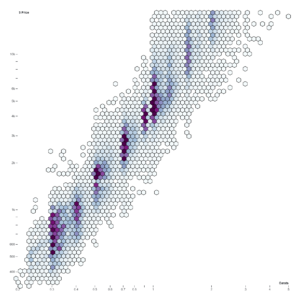
Hexbin
- Original price was: $ 15.$ 10Current price is: $ 10.
- Add to cart
-
- Sale!
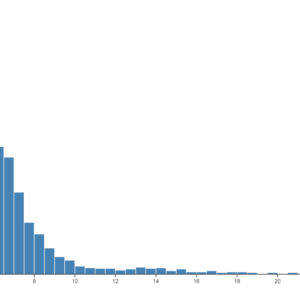
Histogram
- Original price was: $ 15.$ 10Current price is: $ 10.
- Add to cart
Reviews
There are no reviews yet.