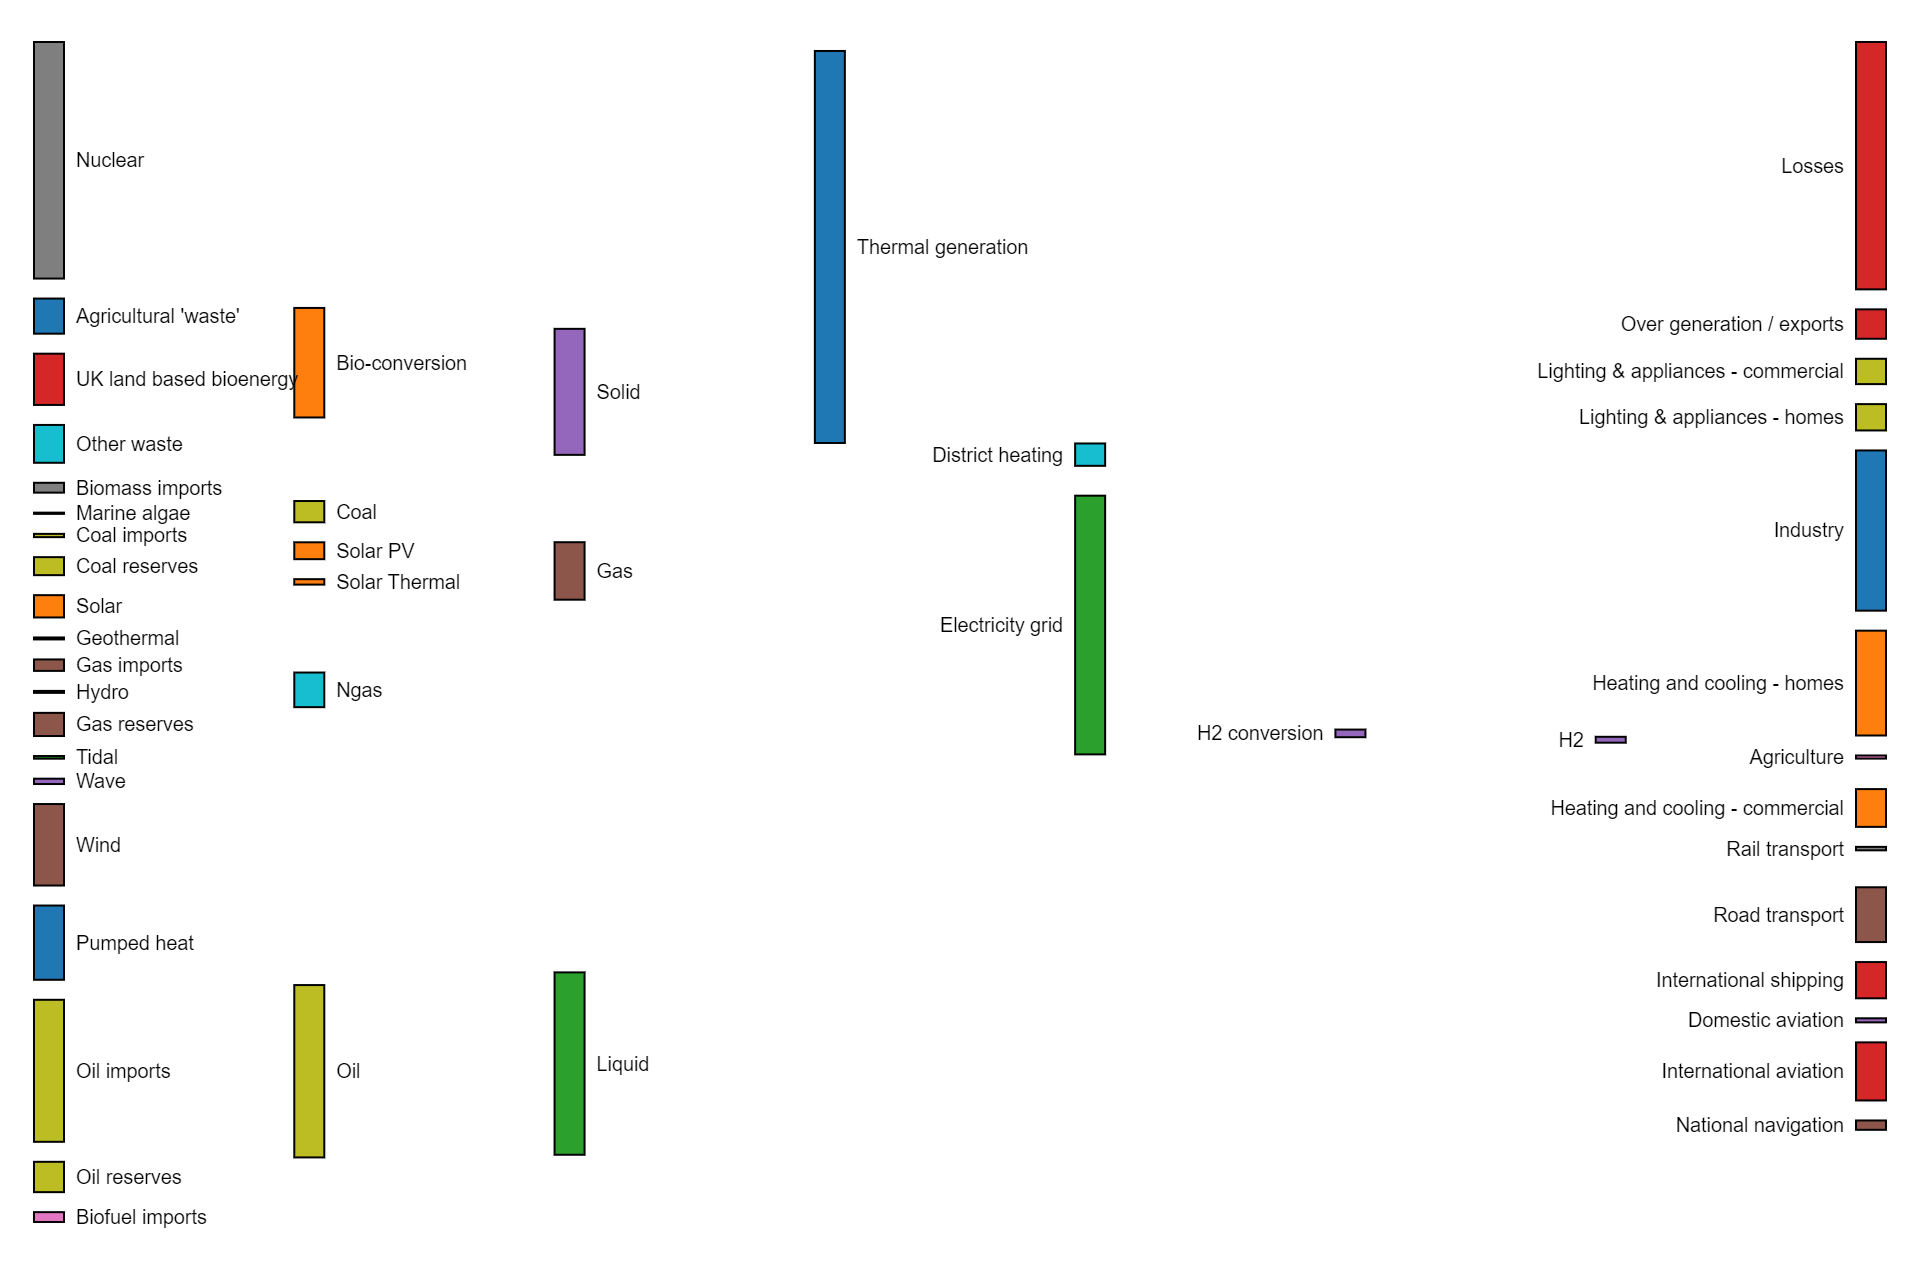
A Sankey diagram is a visual representation that illustrates the flow of energy, resources, or quantities between different entities. It uses proportional arrow widths to show the magnitude of the flow, allowing for a clear understanding of how inputs are transformed into outputs within a system or process.
Purposes :
Sankey diagrams serve several purposes, including:
Visualizing Flow: They provide a clear visual representation of the flow of energy, resources, or quantities within a system, process, or network.
Identifying Trends: Sankey diagrams help in identifying patterns and trends in the distribution and transformation of inputs and outputs.
Analyzing Efficiency: They enable the analysis of efficiency and losses within a system by visually comparing input and output quantities.
Communicating Complex Data: Sankey diagrams simplify complex data by presenting it in a visually intuitive format, making it easier for stakeholders to understand and interpret.
Supporting Decision-Making: They aid decision-making by providing insights into resource allocation, identifying areas for improvement, and evaluating the effectiveness of interventions or changes.
Facilitating Communication: Sankey diagrams facilitate communication between different stakeholders by presenting information in a visually appealing and easily understandable manner.
Overall, Sankey diagrams are versatile tools used across various disciplines, including engineering, economics, environmental science, and data visualization, to analyze and communicate complex systems and processes.
Uses :
Sankey diagrams have numerous uses across various fields and industries, including:
Energy Flow Analysis: They are commonly used to visualize and analyze energy flows within systems, such as energy production, consumption, and distribution in power plants, buildings, or industrial processes.
Resource Management: Sankey diagrams help in understanding the flow of resources like water, materials, or money within systems, aiding in resource management and optimization.
Environmental Studies: They are employed to illustrate environmental flows, such as greenhouse gas emissions, water usage, or waste generation, assisting in environmental impact assessments and sustainability analyses.
Process Optimization: Sankey diagrams can identify inefficiencies and bottlenecks in processes by visualizing the flow of inputs and outputs, enabling process optimization and improvement.
Supply Chain Analysis: They help in visualizing the flow of goods, materials, and information within supply chains, supporting supply chain optimization, logistics planning, and risk management.
Financial Analysis: Sankey diagrams are utilized to represent financial flows, such as budget allocations, revenue streams, or investment portfolios, aiding in financial analysis, planning, and decision-making.
Policy Making: They assist policymakers in understanding complex systems and assessing the impact of policy interventions by visualizing the flow of resources, energy, or emissions within socio-economic systems.
Education and Communication: Sankey diagrams are valuable tools for education and communication, helping to convey complex concepts and data in a visually intuitive and accessible manner.
Overall, Sankey diagrams provide a versatile means of visualizing and analyzing flows within systems, making them invaluable for various applications across disciplines.
Reviews
There are no reviews yet.
Only logged in customers who have purchased this product may leave a review.

Reviews
There are no reviews yet.