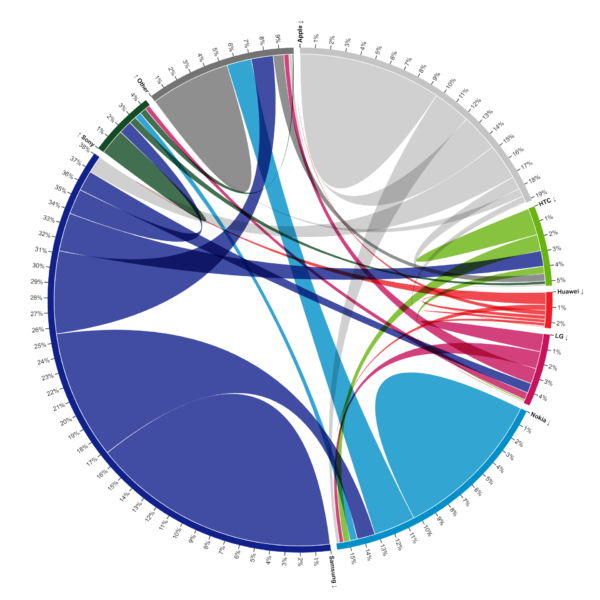
A chord diagram is a circular data visualization that displays relationships or connections between different entities or categories. It consists of a circle divided into segments, with each segment representing a category. Ribbons or chords connect pairs of segments, indicating connections or dependencies between categories. Chord diagrams are useful for visualizing complex networks, flow of information, or dependencies within a dataset. They provide a clear and intuitive way to understand relationships and patterns between entities.
Purposes :
The purposes of a chord diagram include:
Visualizing Relationships: Chord diagrams are effective for visualizing relationships or connections between different entities or categories within a dataset. Each segment of the circle represents a category, and the chords connecting pairs of segments indicate connections or dependencies between categories.
Understanding Interactions: These diagrams help in understanding the interactions and dependencies between different components or variables within a system. By observing the chords connecting the segments, users can identify which entities are related or connected to each other.
Analyzing Network Structures: Chord diagrams are commonly used in network analysis to visualize the structure and connectivity of networks. They help in identifying patterns, clusters, and pathways within the network, as well as analyzing the strength and frequency of connections.
Detecting Patterns and Trends: Chord diagrams aid in detecting patterns or trends in the relationships between entities. Users can observe the distribution of chords and identify clusters or groups of entities that are strongly connected or dependent on each other.
Identifying Dependencies: Chord diagrams help in identifying dependencies or connections that may impact decision-making or system design. By visualizing the relationships between entities, users can identify dependencies that may affect the behavior or performance of the system.
Enhancing Data Presentation: Chord diagrams provide a visually appealing way to present complex relationships or dependencies in a dataset. Their circular layout and clear visualization of connections make them an effective tool for communicating insights to stakeholders.
Overall, the purposes of a chord diagram revolve around visualizing relationships, understanding interactions, analyzing network structures, detecting patterns and trends, identifying dependencies, and enhancing the presentation of data in various domains and applications.
Uses :
The uses of a chord diagram include:
Network Analysis: Chord diagrams are commonly used in network analysis to visualize relationships and connections between different entities or nodes in a network. They help in understanding the structure and connectivity of complex networks, such as social networks, biological networks, or transportation networks.
Flow Visualization: These diagrams are useful for visualizing the flow of information, resources, or dependencies between different entities or categories in a system. They provide a clear representation of the connections between entities, allowing viewers to understand how data or resources move through the system.
Dependency Analysis: Chord diagrams help in analyzing dependencies or causal relationships between different elements in a dataset or system. By visualizing the connections between entities, users can identify which entities influence or depend on each other.
Process Mapping: Chord diagrams can be used in process mapping to visualize the sequence of steps or activities in a process. They help in understanding the dependencies between different tasks or activities and identifying bottlenecks or areas for improvement.
Gene Regulatory Networks: In biological research, chord diagrams are used to visualize gene regulatory networks, where genes regulate the expression of other genes. They help in understanding the complex interactions between genes and identifying key regulators in biological processes.
Supply Chain Analysis: These diagrams are useful for visualizing dependencies and relationships within supply chains. They help in understanding how different parts of the supply chain are interconnected and how disruptions in one area may affect the entire chain.
Music Analysis: Chord diagrams can be used in music analysis to visualize the relationships between chords or musical notes in a piece of music. They help in understanding the structure and harmonic relationships within the music.
Overall, chord diagrams are versatile visualization tools that can be applied in various domains and applications to analyze networks, visualize flow of information, conduct dependency analysis, map processes, study gene regulatory networks, analyze supply chains, and analyze music compositions.
Reviews
There are no reviews yet.
Only logged in customers who have purchased this product may leave a review.

Reviews
There are no reviews yet.