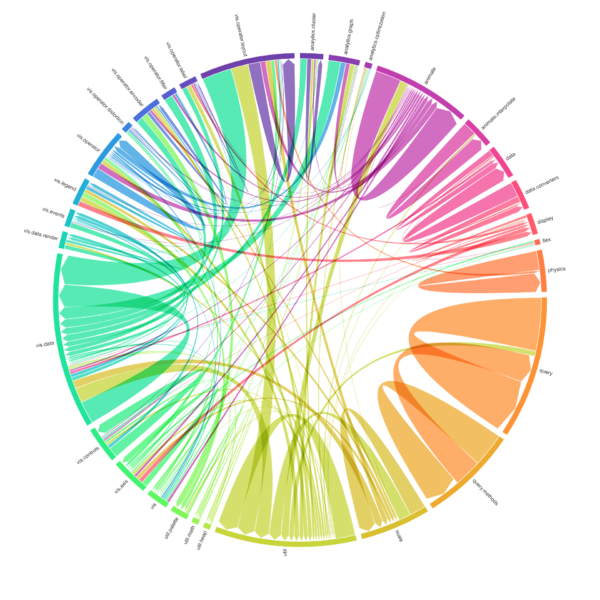
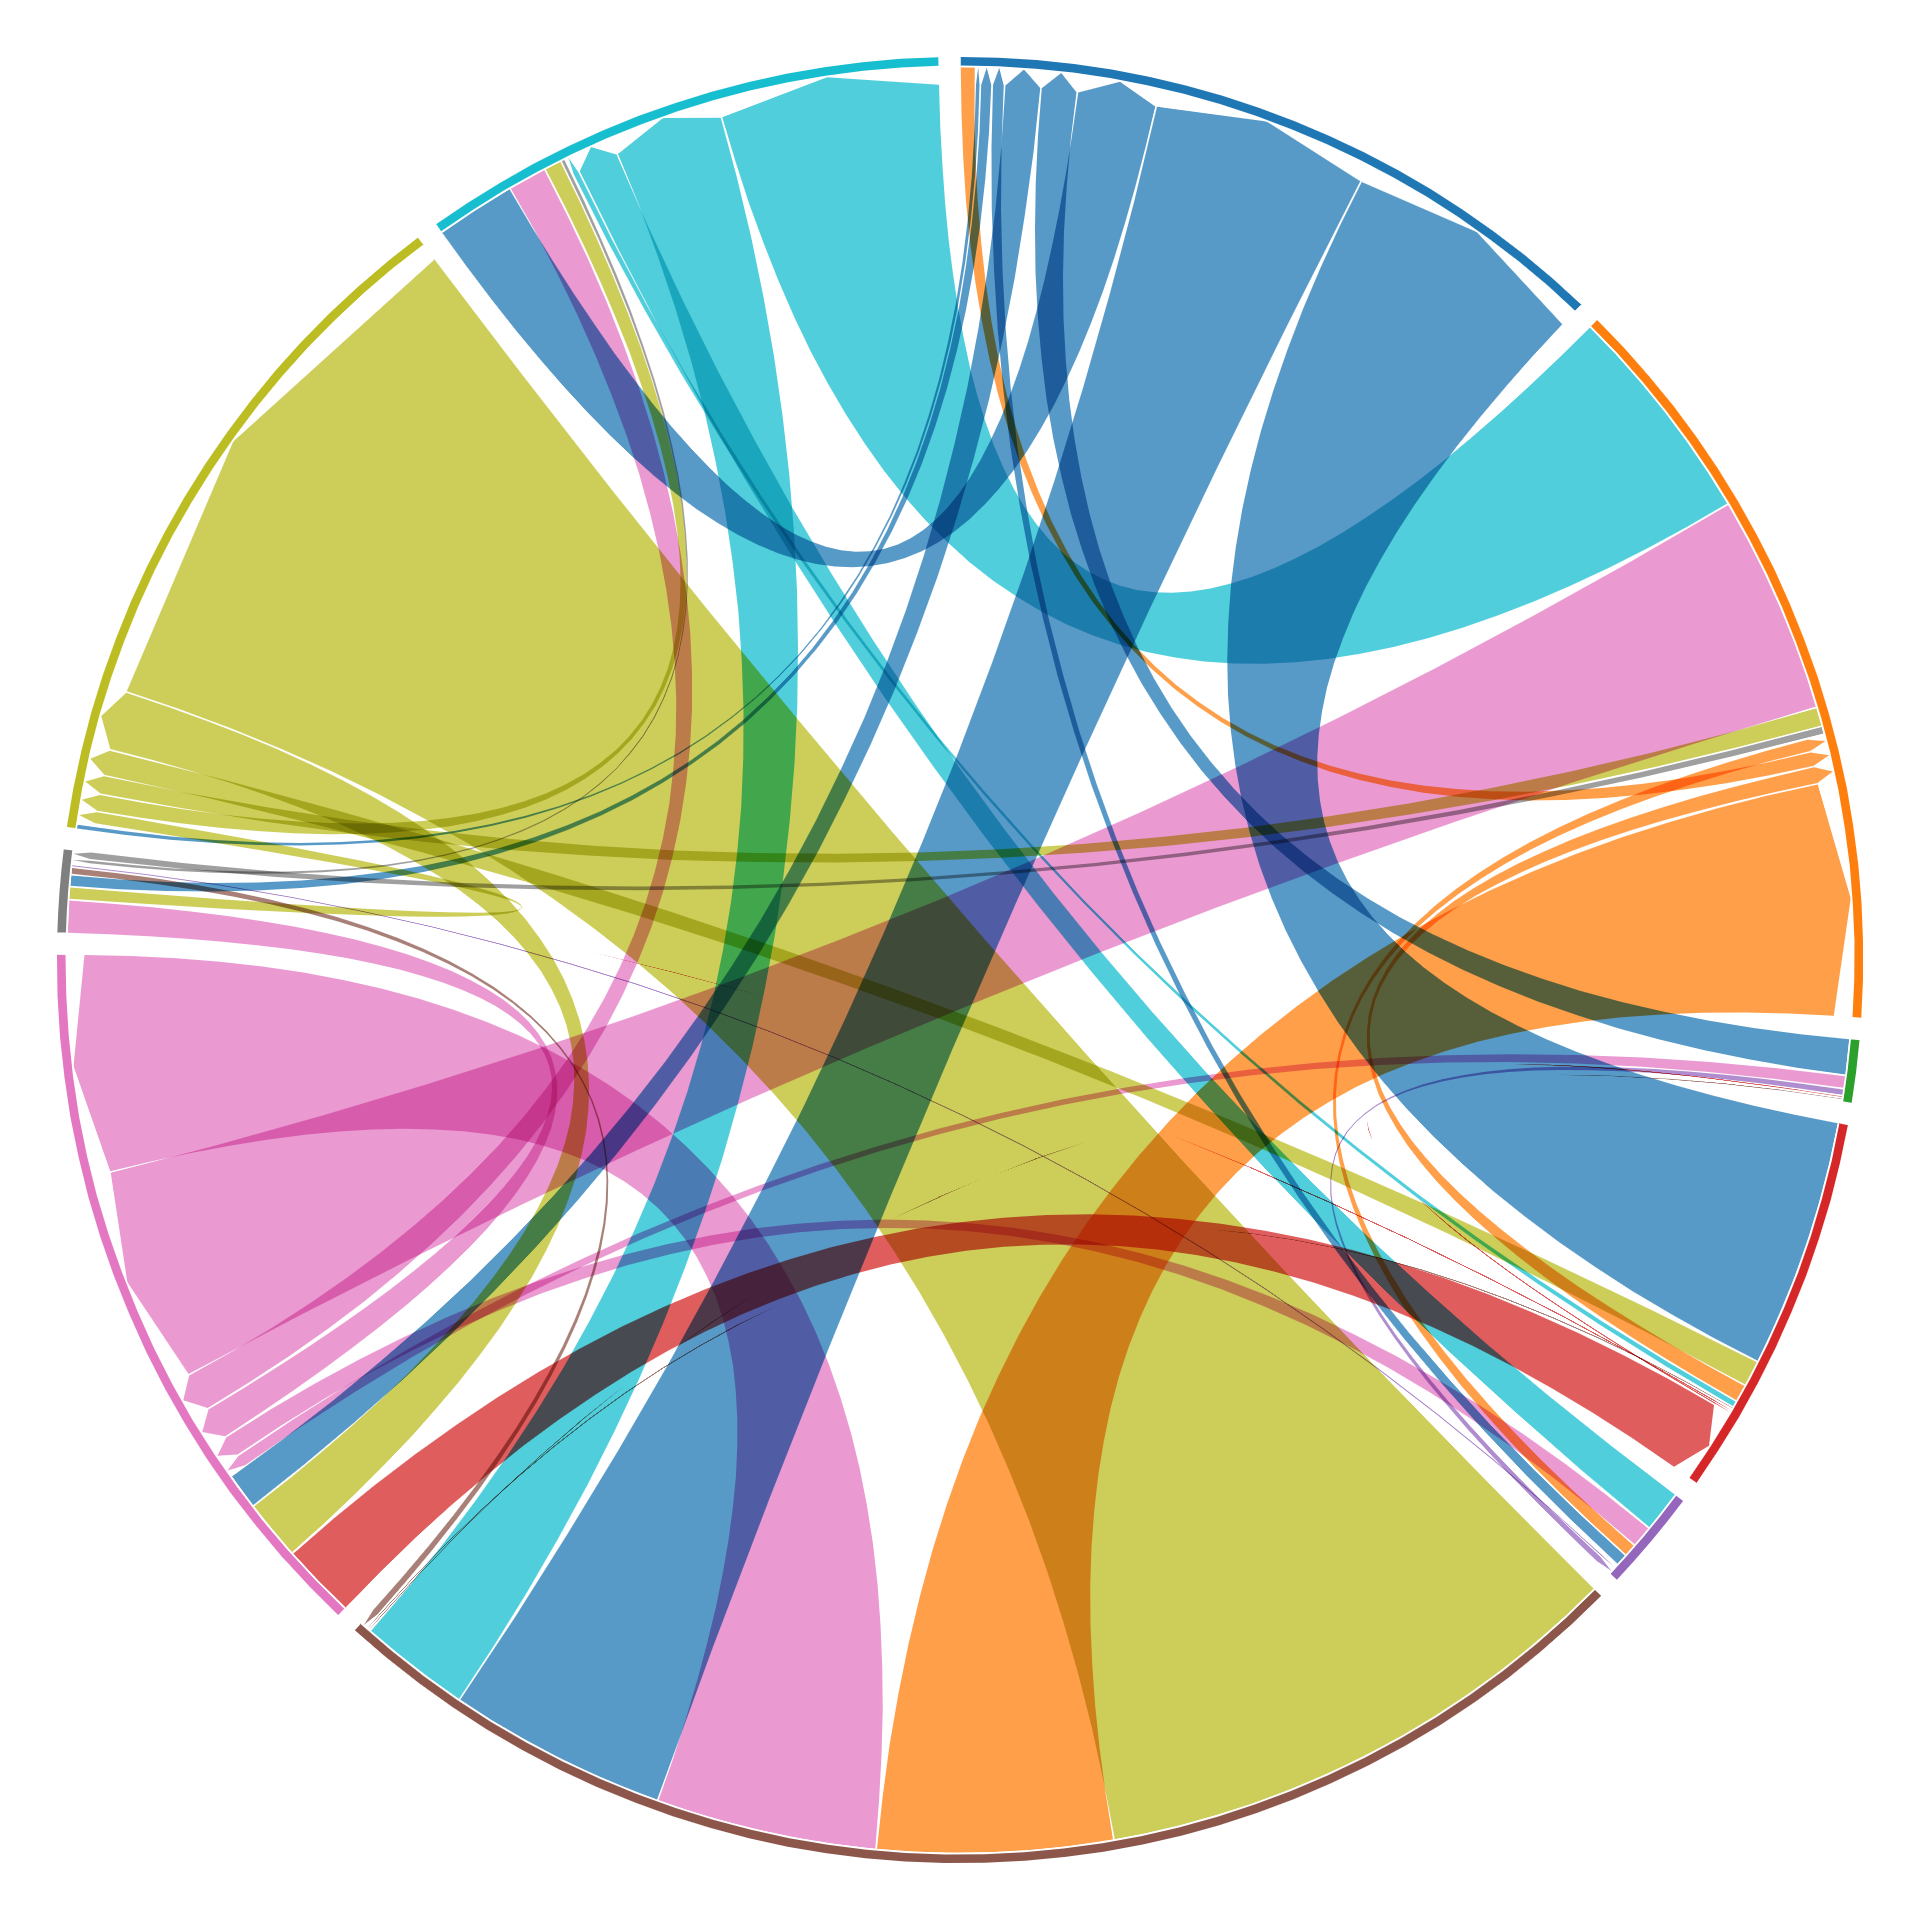
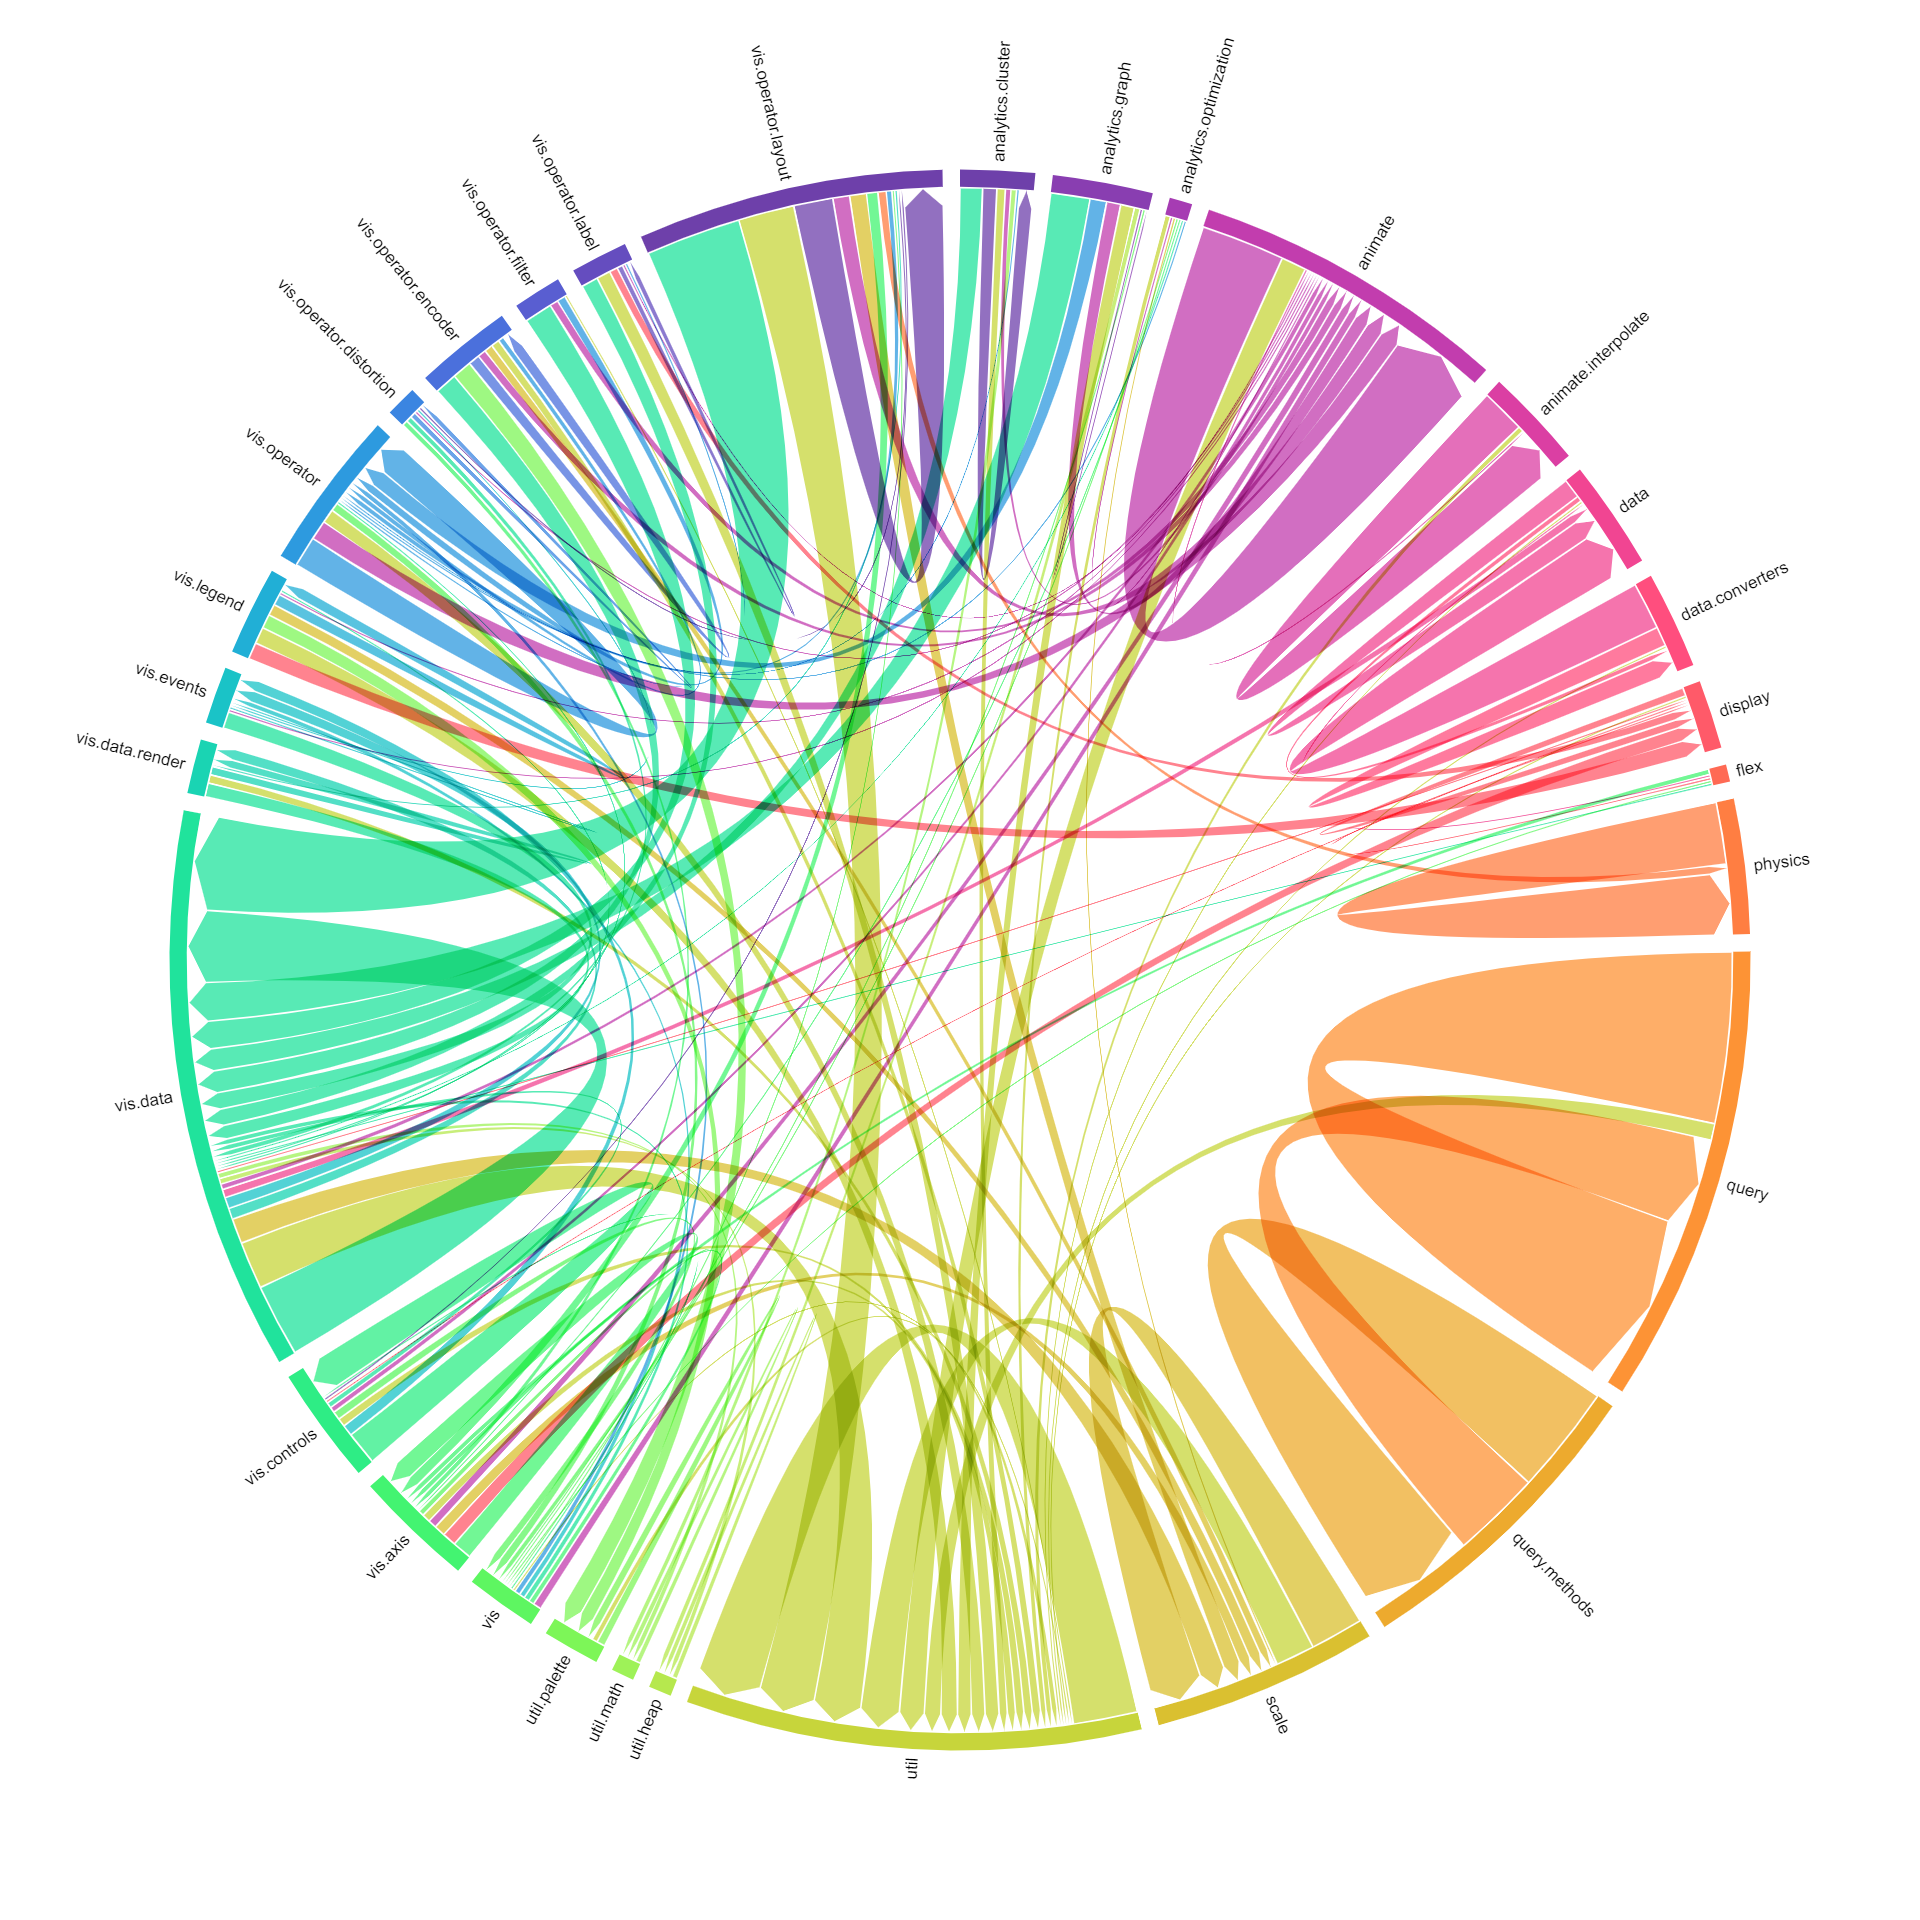
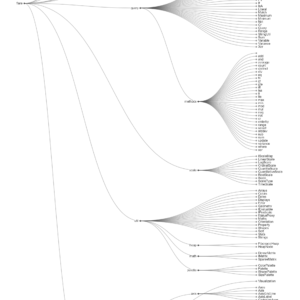
A chord dependency diagram is a graphical representation used to visualize relationships or dependencies between different entities or variables. It typically consists of a circle divided into segments, with each segment representing a category or variable. Lines, or “chords,” connect the segments to show the strength or presence of dependencies between them. Chord dependency diagrams are commonly used in data analysis, network visualization, and systems modeling to uncover connections and dependencies between various components.
Purposes :
The purposes of a chord dependency diagram include:
Visualizing Relationships: Chord dependency diagrams are used to visualize relationships or dependencies between different entities or categories within a dataset. Each entity is represented as a segment of the outer circle, and the chords connecting the segments indicate the dependencies or connections between them.
Understanding Interactions: These diagrams help in understanding the interactions and dependencies between different components or variables within a system. By observing the chords connecting the segments, users can identify which entities are dependent on each other and how they interact.
Analyzing Flow of Information: Chord dependency diagrams are useful for analyzing the flow of information or resources between different entities. The chords represent the flow of information or dependencies, allowing users to track the transfer of data or resources within a system.
Identifying Patterns and Trends: Chord dependency diagrams aid in identifying patterns or trends in the relationships between entities. Users can observe the distribution of chords and identify clusters or groups of entities that are strongly connected or dependent on each other.
Detecting Dependencies: These diagrams help in detecting dependencies or connections that may not be immediately apparent in the data. By visualizing the relationships between entities, users can identify dependencies that may impact decision-making or system design.
Enhancing Data Presentation: Chord dependency diagrams provide a visually appealing way to present complex relationships or dependencies in a dataset. Their circular layout and clear visualization of connections make them an effective tool for communicating insights to stakeholders.
Overall, the purposes of a chord dependency diagram revolve around visualizing relationships, understanding interactions, analyzing flow of information, identifying patterns and trends, detecting dependencies, and enhancing the presentation of data in various domains and applications.
Uses :
The uses of a chord dependency diagram include:
Network Analysis: Chord dependency diagrams are commonly used in network analysis to visualize relationships and dependencies between different nodes or entities in a network. They help in understanding the structure and connectivity of complex networks.
Software Dependency Analysis: These diagrams are used in software engineering to visualize dependencies between different components or modules of a software system. They help developers understand how changes to one component may impact other components.
Supply Chain Analysis: Chord dependency diagrams are useful for analyzing dependencies and relationships within supply chains. They help in understanding how different parts of the supply chain are interconnected and how disruptions in one area may affect the entire chain.
Genetic Interaction Analysis: In genetics, chord dependency diagrams are used to visualize interactions between genes or genetic pathways. They help researchers understand how genes interact with each other and contribute to complex traits or diseases.
Business Process Analysis: These diagrams are used in business process analysis to visualize dependencies between different processes or activities within an organization. They help in identifying bottlenecks, inefficiencies, and dependencies that may impact overall performance.
Project Management: Chord dependency diagrams can be used in project management to visualize dependencies between different tasks or activities in a project schedule. They help project managers understand the critical path and identify dependencies that may affect project timelines.
Customer Relationship Management (CRM): In CRM, chord dependency diagrams can be used to visualize dependencies between different customer touchpoints or channels. They help in understanding how interactions with customers across different channels influence overall customer satisfaction and loyalty.
Overall, chord dependency diagrams are versatile visualization tools that can be applied in various domains and applications to analyze relationships, dependencies, and interactions between different entities or components.
Reviews
There are no reviews yet.
Only logged in customers who have purchased this product may leave a review.
Reviews
There are no reviews yet.