Description
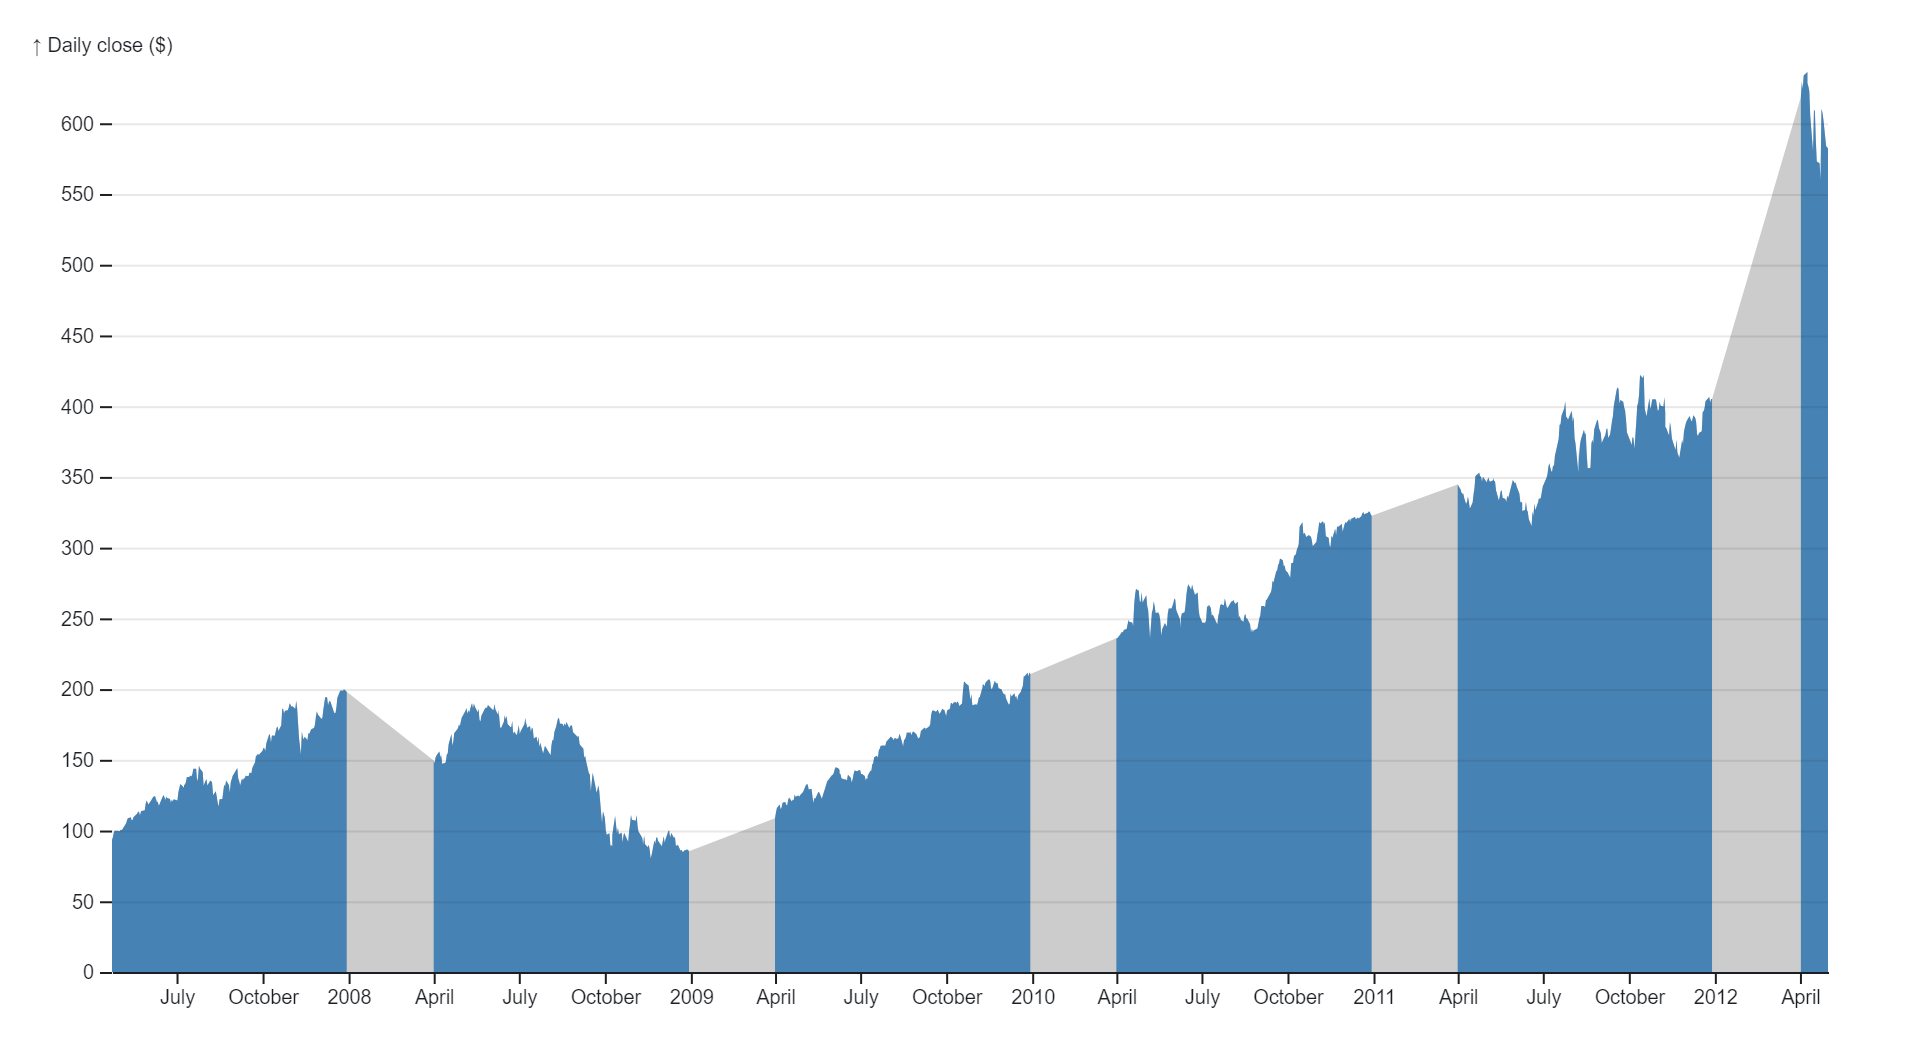
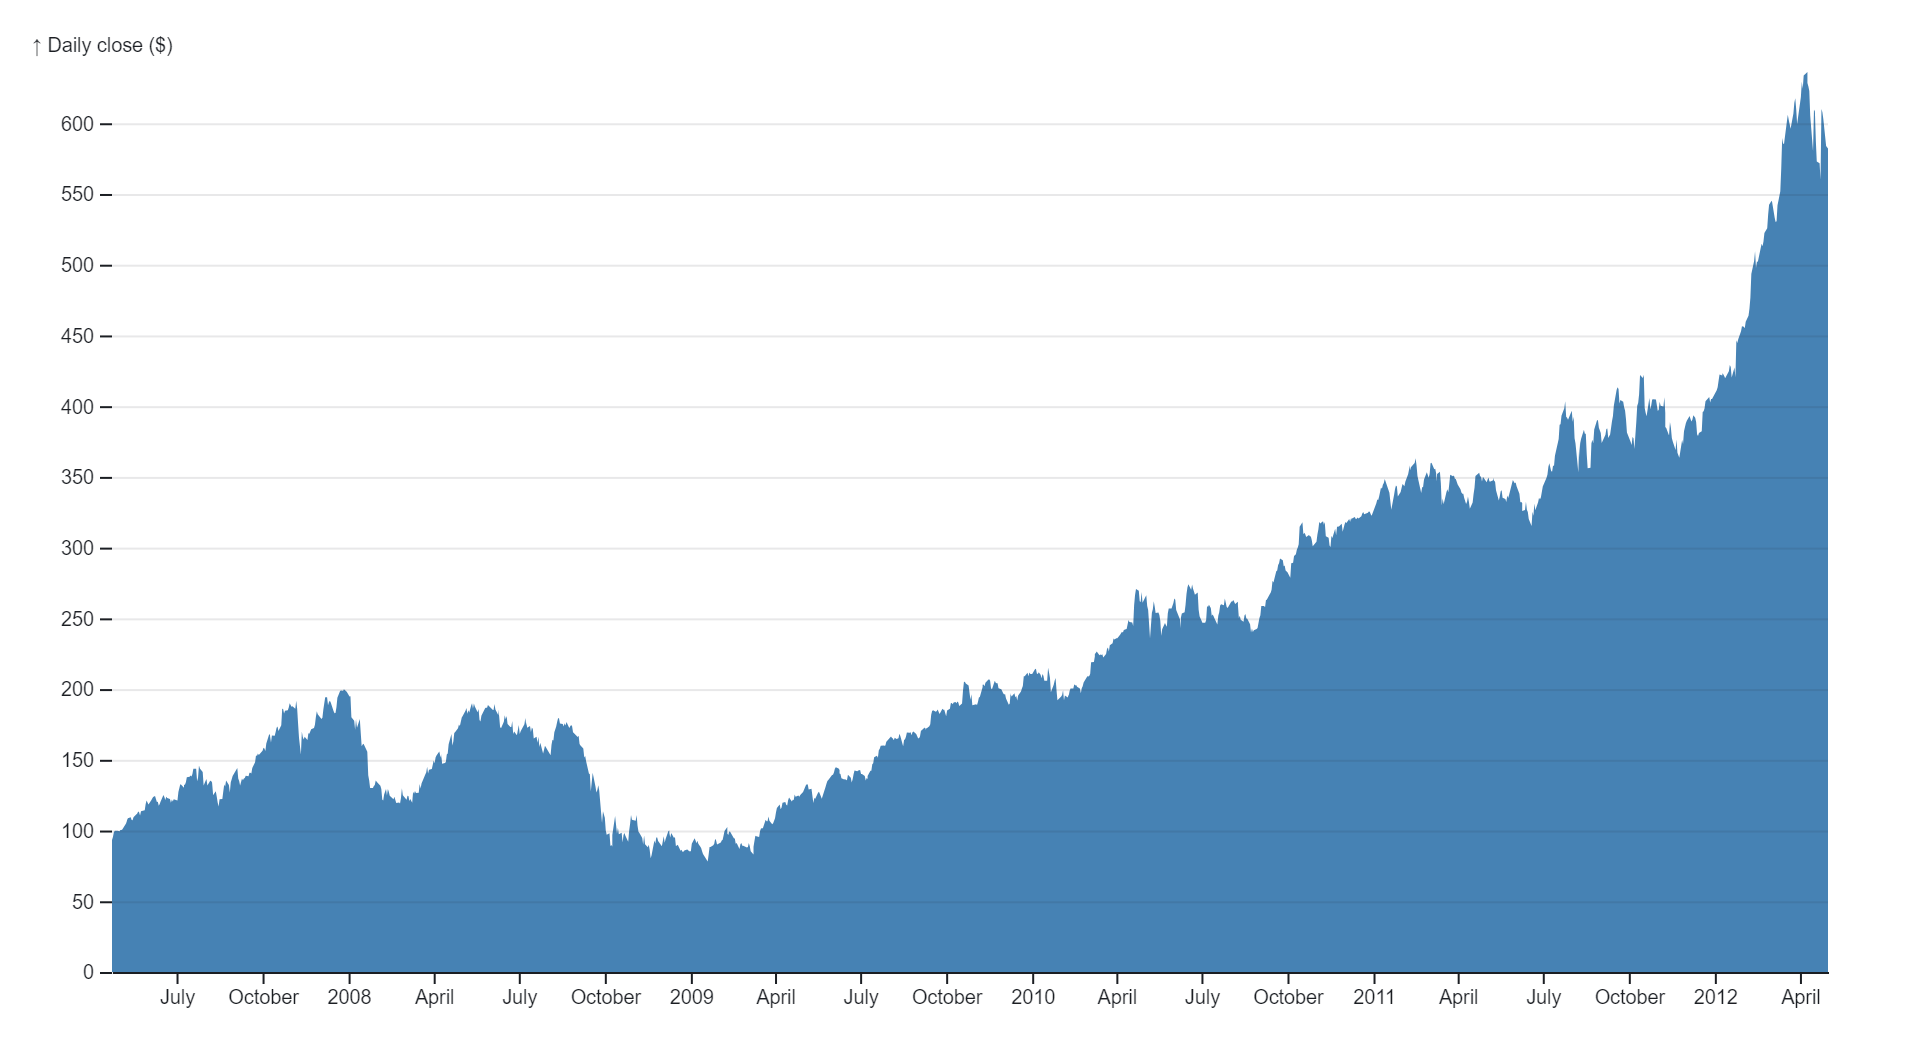
Area charts are a type of data visualization used to represent quantitative data over time or across categories, where the area between the line representing the data and the axis is filled with color or shading. Similar to line charts, area charts display trends and patterns in data, but they provide additional visual emphasis by filling the space below the line, creating a sense of volume or magnitude. This filled area can represent cumulative totals, proportions, or distributions, depending on the data being visualized. Area charts are particularly effective for illustrating the magnitude of change over time or comparing the contributions of different categories to a total. They are commonly used in finance to track stock prices or market trends, in economics to depict economic indicators like GDP growth, and in environmental science to visualize changes in temperature or precipitation over time. Additionally, area charts are useful for highlighting seasonal patterns, identifying trends, and comparing data sets. Their visual appeal and ability to convey complex data in a clear and intuitive manner make area charts a popular choice for data visualization across various industries and applications.
Uses:
- Tracking Trends Over Time: Area charts are commonly used to track trends in data over time, such as stock prices, sales figures, or website traffic.
- Comparing Multiple Data Series: They are useful for comparing multiple data series on the same chart, allowing viewers to see how different categories or variables change over time.
- Highlighting Cumulative Totals: Area charts effectively highlight cumulative totals or aggregate values, making it easy to visualize the overall trend or magnitude of change.
- Visualizing Proportions: They can be used to visualize proportions or percentages within a dataset, where the filled area represents the proportion of the total.
- Identifying Seasonal Patterns: Area charts are helpful for identifying seasonal patterns or cyclical trends in data, such as seasonal sales fluctuations or weather patterns.
- Showing Distribution of Data: They can illustrate the distribution of data over time or across categories, helping viewers understand the spread or variability within the dataset.
- Comparing Contributions to a Whole: Area charts are effective for comparing the contributions of different categories or variables to a total, highlighting relative importance or magnitude.
- Highlighting Trends and Patterns: They help highlight trends, patterns, and anomalies within the data, making it easier for viewers to identify important insights.
- Forecasting Future Trends: Area charts can aid in forecasting future trends based on historical data, allowing viewers to anticipate future outcomes or changes.
- Presenting Cumulative Data: They are useful for presenting cumulative data, such as cumulative revenue or cumulative sales, over a specific period.
Purposes:
- Data Visualization: The primary purpose of area charts is to visually represent data in a clear and understandable manner, making it easier for viewers to interpret and analyze.
- Trend Analysis: Area charts facilitate trend analysis by allowing viewers to identify and analyze trends in the data over time or across categories.
- Comparative Analysis: They support comparative analysis by providing a visual comparison of multiple data series, helping viewers understand similarities, differences, and relationships.
- Pattern Recognition: Area charts aid in pattern recognition by highlighting trends, cycles, and patterns within the data, making it easier for viewers to identify important insights.
- Communication: They serve as effective communication tools for presenting data to stakeholders, clients, or colleagues in a visually appealing and accessible format.
- Decision Making: Area charts support data-driven decision-making processes by providing insights and information that can inform strategic decisions or actions.
- Forecasting: They can assist in forecasting future trends or outcomes based on historical data, helping viewers anticipate future developments and plan accordingly.
- Performance Monitoring: Area charts are useful for monitoring performance metrics and key performance indicators (KPIs) over time, allowing viewers to track progress and identify areas for improvement.
- Storytelling: They can be used to tell a visual story about the data, highlighting key events, trends, or milestones and guiding viewers through the narrative.
- Educational Tool: Area charts serve as educational tools for teaching data analysis concepts and techniques, allowing students to explore and understand data visually.
Only logged in customers who have purchased this product may leave a review.
Related products
-
- Sale!
Kernal Density Estimation
- Original price was: $ 15.$ 10Current price is: $ 10.
- Add to cart
-
- Sale!
Tidy Tree
- Original price was: $ 15.$ 10Current price is: $ 10.
- Add to cart
-
- Sale!
Nested Tree Map
- Original price was: $ 15.$ 10Current price is: $ 10.
- Add to cart
Reviews
There are no reviews yet.