Description
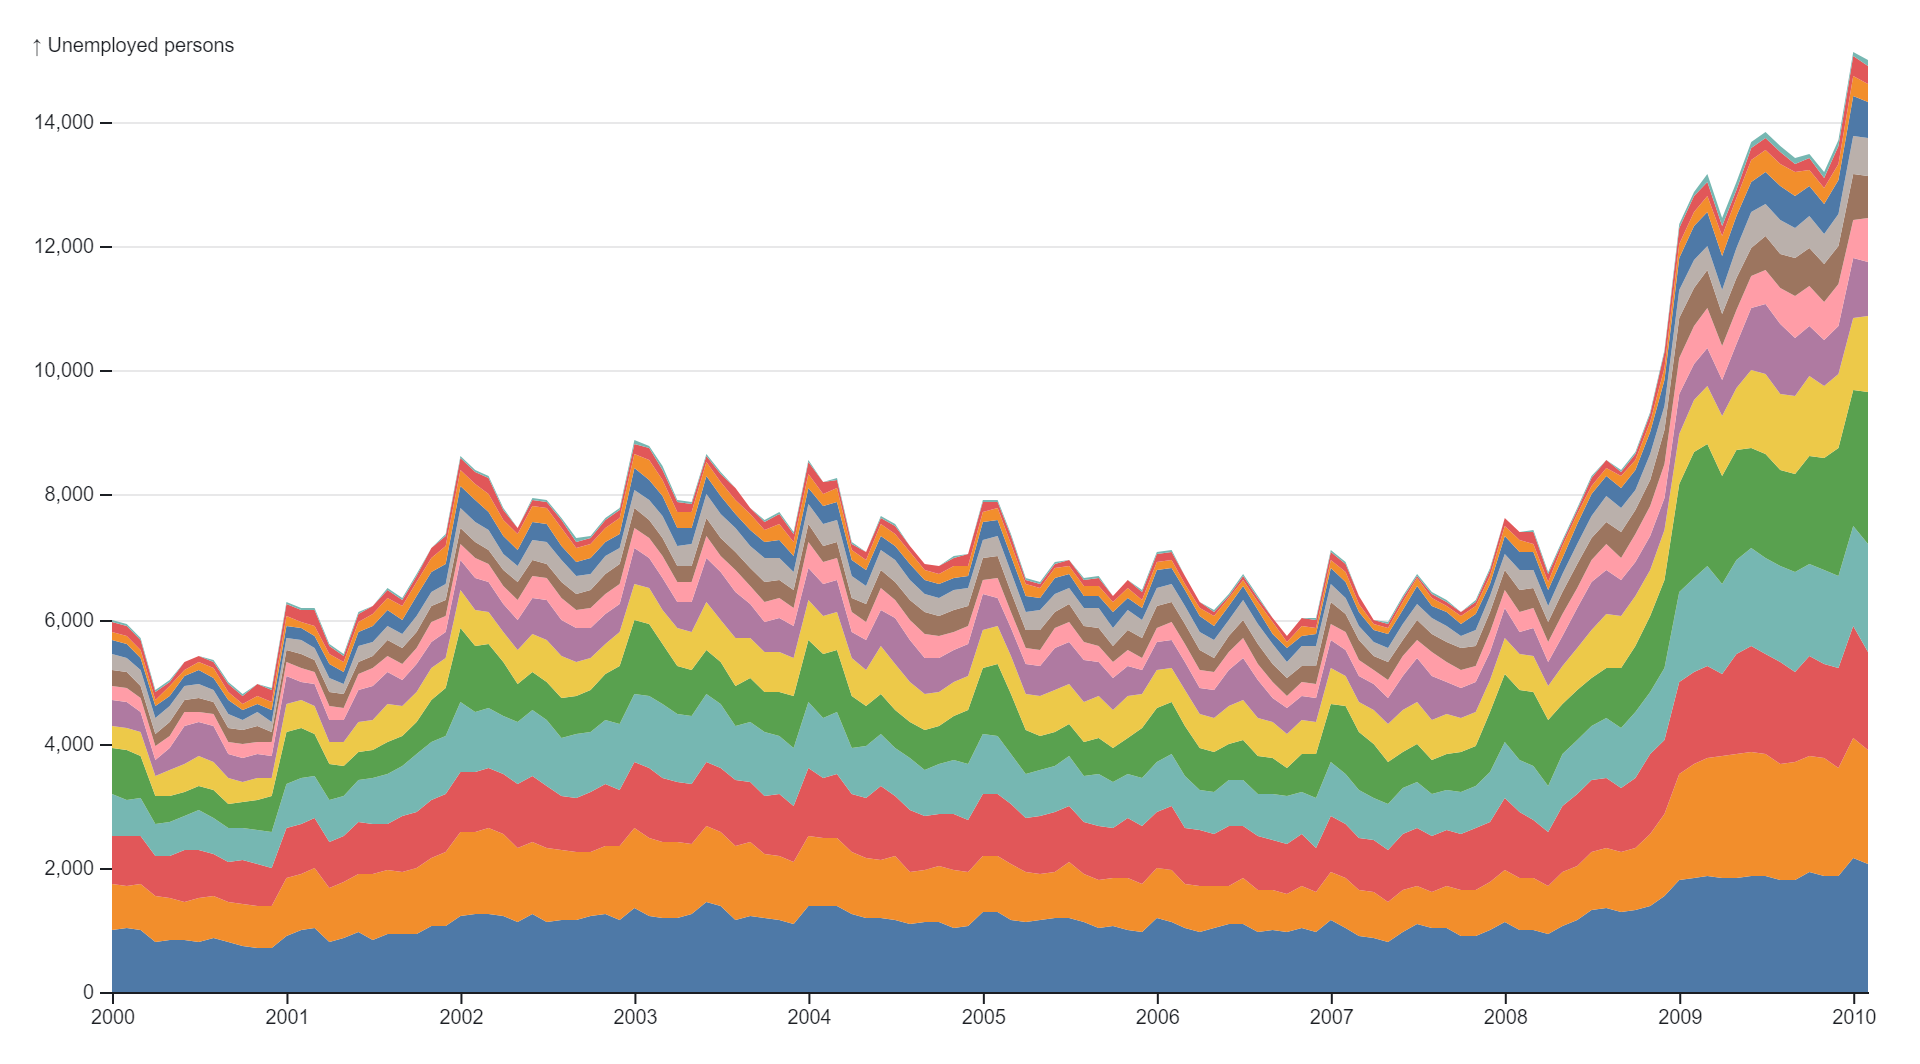
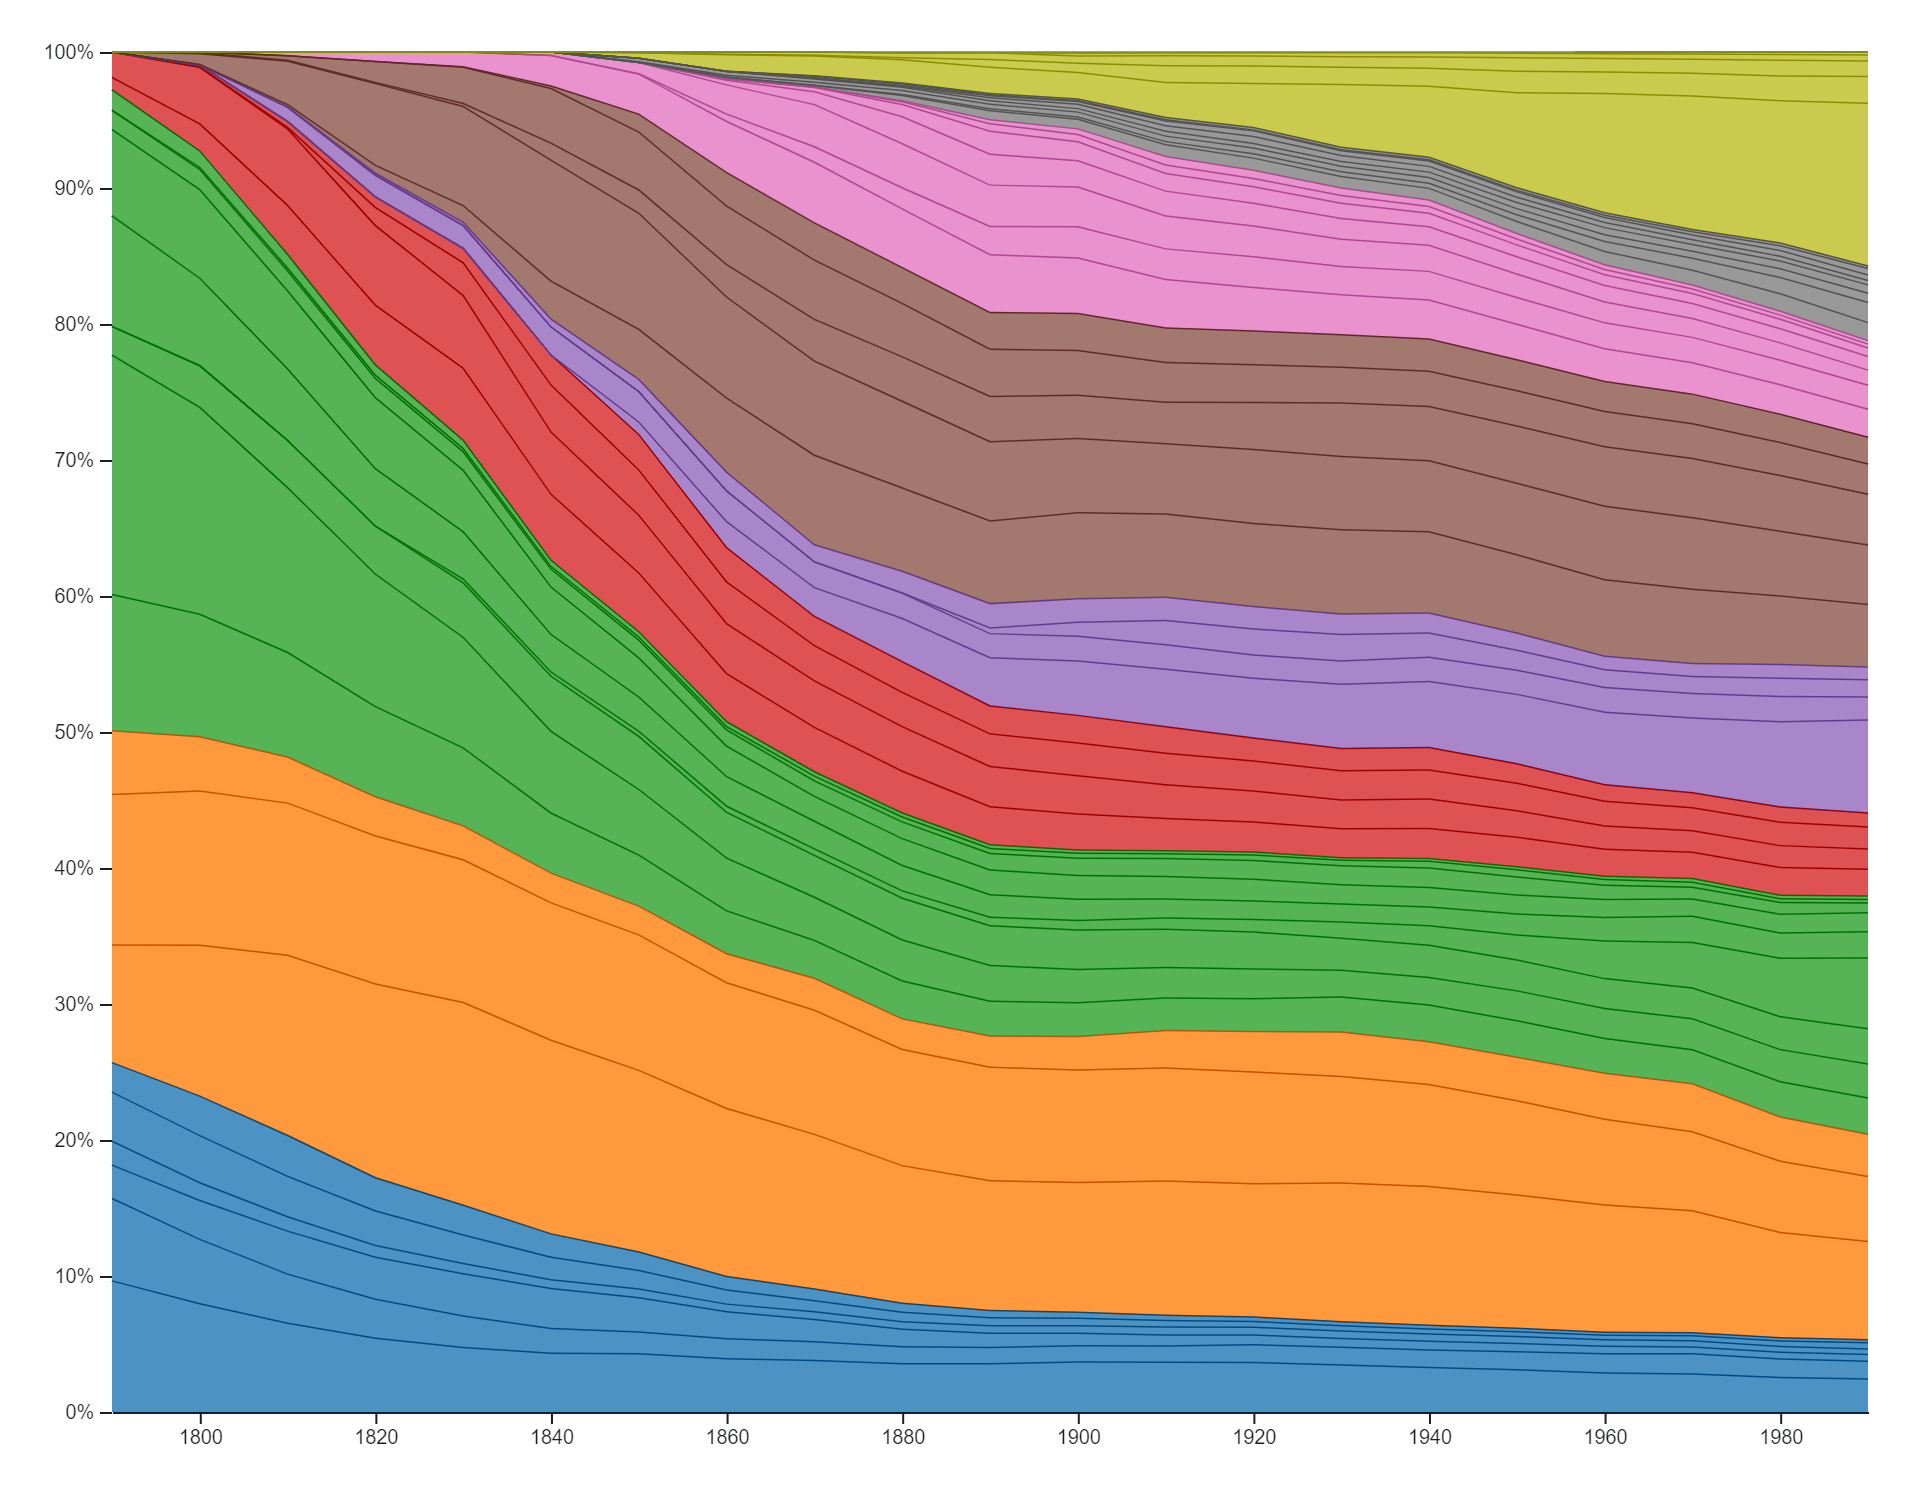
A normalized stacked area chart is a data visualization tool used to represent multiple datasets or categories over a period of time, where each category’s values are stacked on top of each other to form a cumulative total. Unlike a traditional stacked area chart, where the absolute values of each category are displayed, in a normalized stacked area chart, the values are scaled or normalized to a common baseline, typically 100% or 1. This normalization allows for easy comparison of the relative proportions of each category over time, irrespective of differences in the absolute values. Each category’s contribution to the total is expressed as a percentage of the whole, providing insights into the distribution of values across different categories while maintaining consistency in scale. Normalized stacked area charts are particularly useful for visualizing the relative composition or distribution of data across multiple categories or groups over time. They help identify trends, patterns, or shifts in distribution within the data set, facilitating comparisons and analysis. Common applications of normalized stacked area charts include visualizing market share trends, tracking budget allocations across different expense categories, or analyzing demographic trends over time. Overall, normalized stacked area charts offer a visually intuitive and effective way to explore and understand the relative proportions of data categories within a dataset over time.
Uses:
- Comparing Proportions: Normalized stacked area charts are used to compare the relative proportions of different categories or groups within a dataset over time.
- Visualizing Market Share: They are commonly used in business and marketing to visualize market share trends among competitors over time.
- Tracking Budget Allocations: Normalized stacked area charts help track budget allocations across different expense categories or departments over time.
- Analyzing Demographic Trends: They aid in analyzing demographic trends by visualizing the distribution of population segments over time.
- Monitoring Resource Utilization: Normalized stacked area charts are useful for monitoring the utilization of resources, such as manpower or equipment, across different departments or projects over time.
- Visualizing Product Sales: They assist in visualizing product sales trends and market penetration rates for different product categories or brands over time.
- Tracking Performance Metrics: Normalized stacked area charts help track performance metrics, such as website traffic sources or customer acquisition channels, over time.
- Analyzing Financial Data: They aid in analyzing financial data by visualizing the relative contributions of different revenue streams or expense categories over time.
- Projecting Growth Trends: Normalized stacked area charts can be used to project growth trends or forecast future proportions of data categories based on historical patterns.
- Assessing Campaign Effectiveness: They assist in assessing the effectiveness of marketing campaigns or promotional efforts by visualizing changes in customer engagement or response rates over time.
Purposes:
- Comparison: The primary purpose of normalized stacked area charts is to facilitate comparison of the relative proportions of different categories within a dataset over time.
- Trend Analysis: They aid in trend analysis by visualizing changes in the distribution of data categories over time, allowing users to identify trends or patterns.
- Relative Performance Evaluation: Normalized stacked area charts help evaluate the relative performance or contributions of different categories or groups within a dataset.
- Pattern Recognition: They facilitate pattern recognition by visually highlighting changes in the distribution or composition of data categories over time.
- Insights Generation: Normalized stacked area charts support insights generation by providing a visual representation of data proportions, facilitating data-driven decision-making.
- Communication: They serve as a communication tool for presenting complex data in a visually intuitive format, making it easier for stakeholders to understand and interpret.
- Forecasting: Normalized stacked area charts aid in forecasting future proportions of data categories based on historical trends or patterns.
- Resource Allocation: They assist in resource allocation decisions by providing insights into the distribution of resources across different categories or departments over time.
- Identifying Anomalies: Normalized stacked area charts help identify anomalies or deviations from expected patterns in the distribution of data categories over time.
- Performance Monitoring: They support performance monitoring by visualizing changes in the relative contributions of different factors or variables to overall performance metrics over time.
Only logged in customers who have purchased this product may leave a review.

Reviews
There are no reviews yet.