
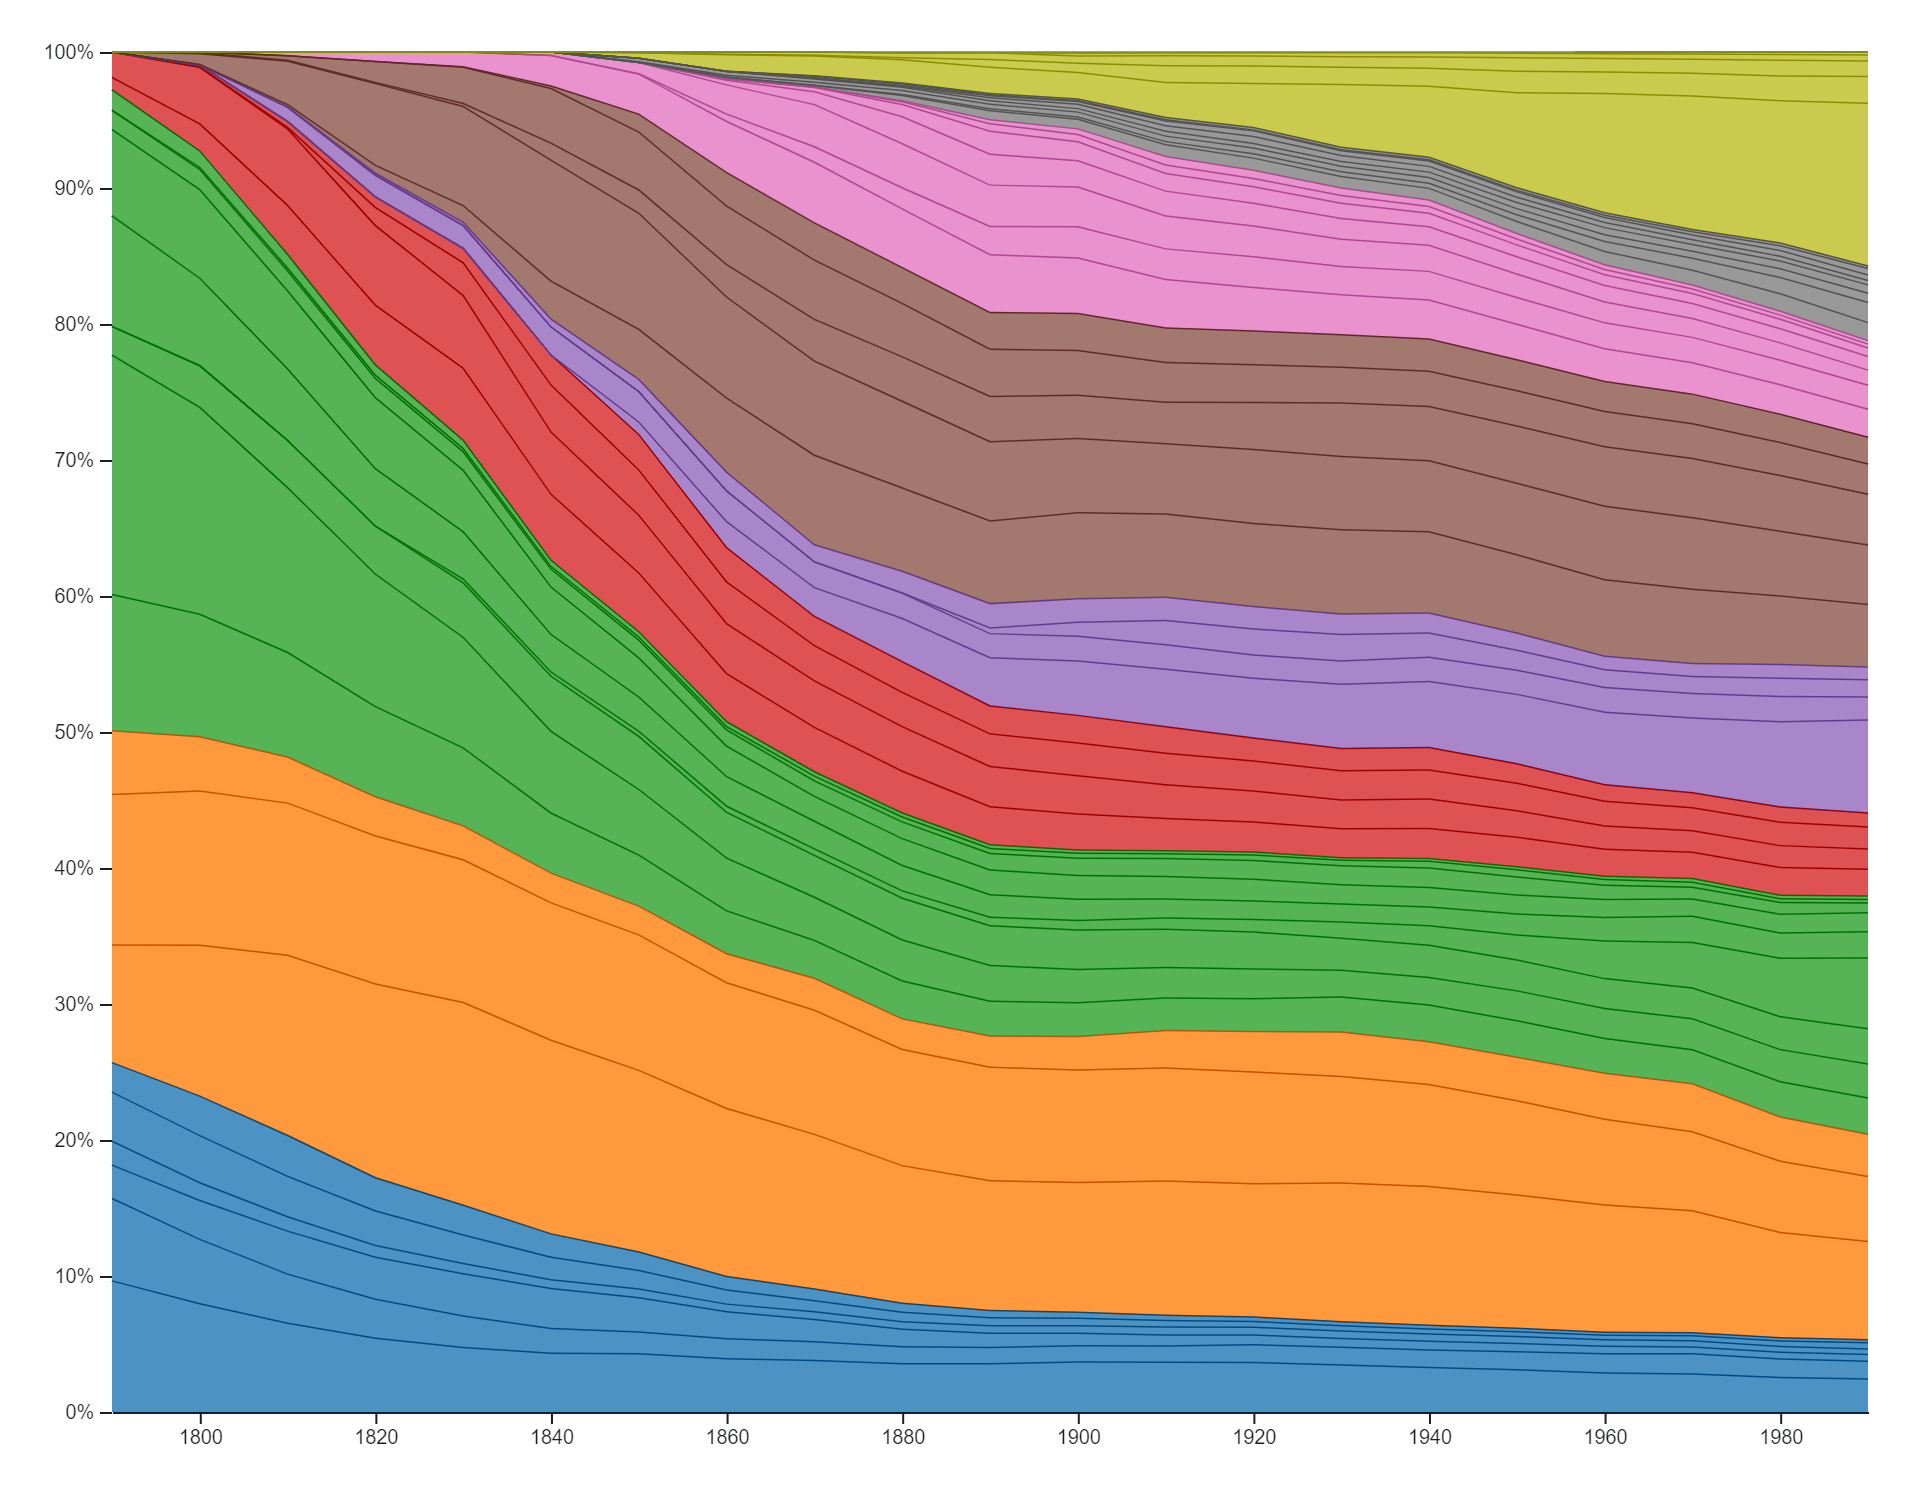
US Population by State 1790-1990
Original price was: $ 15.$ 10Current price is: $ 10.
Description
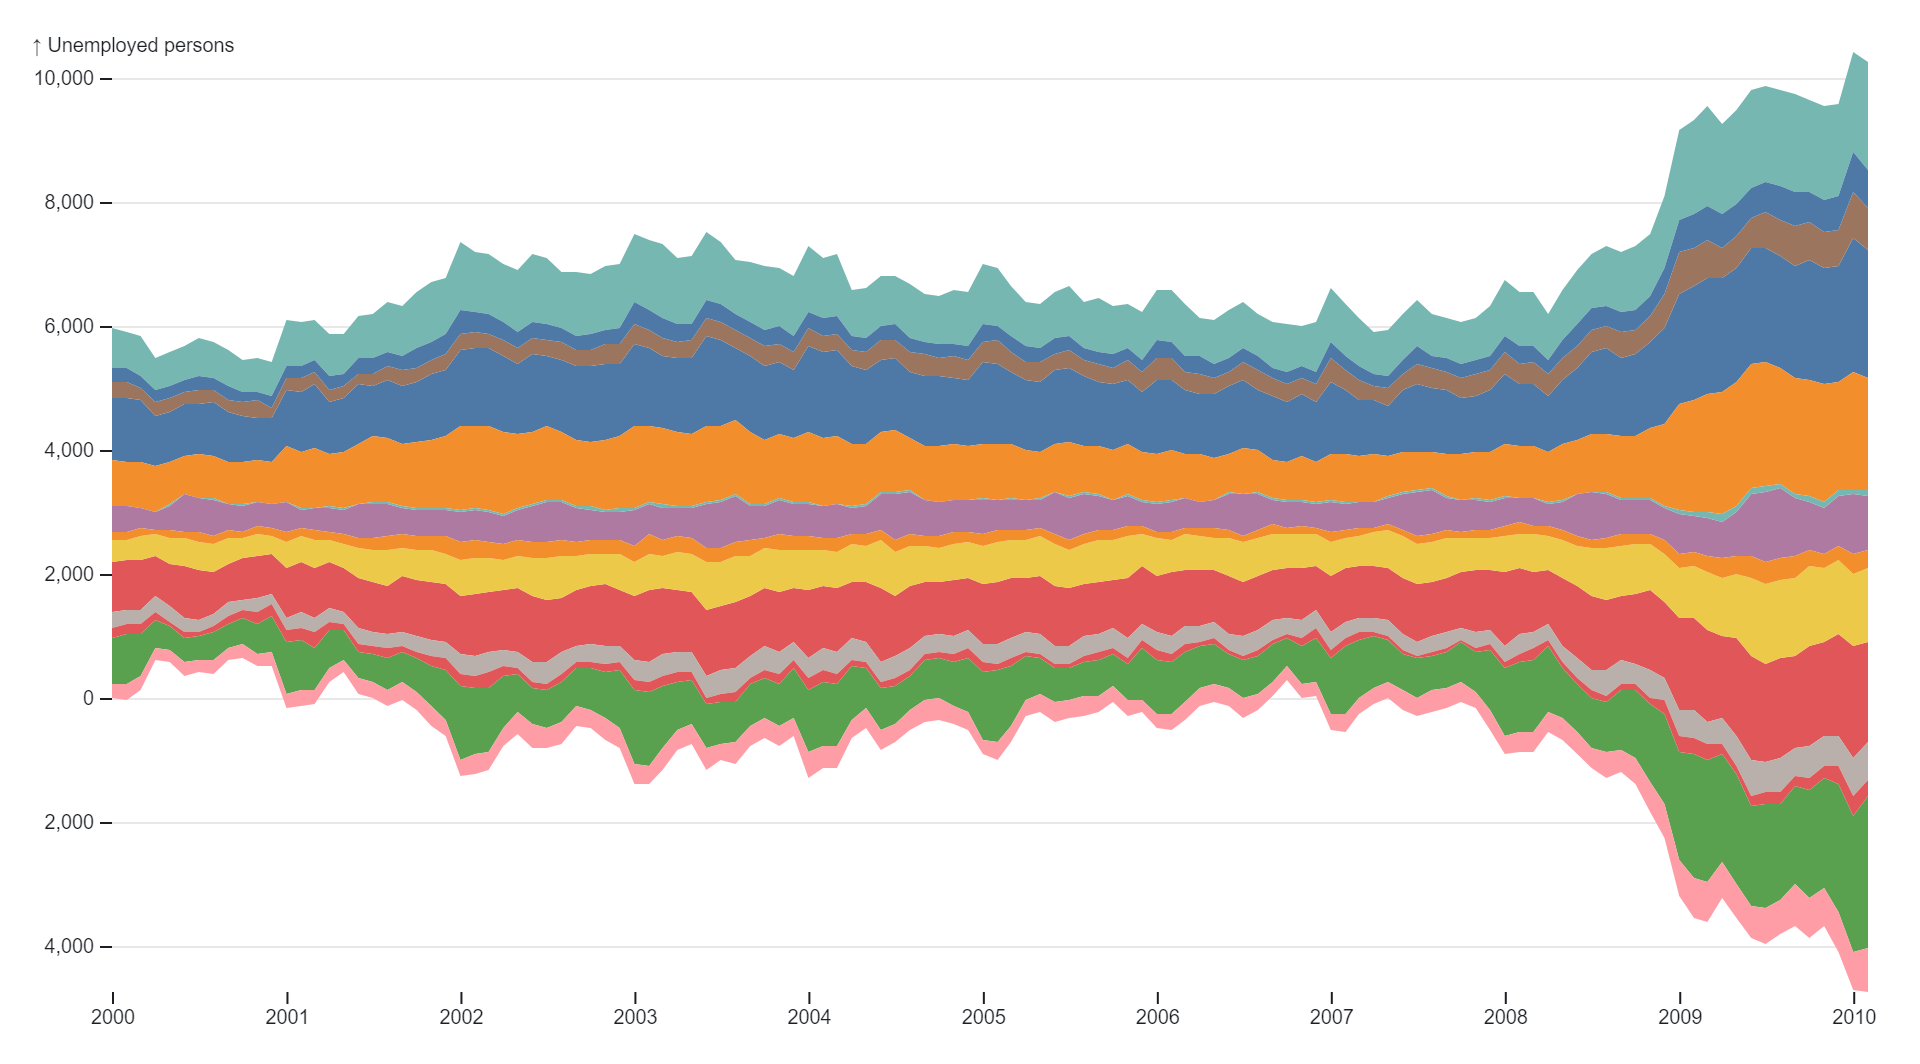
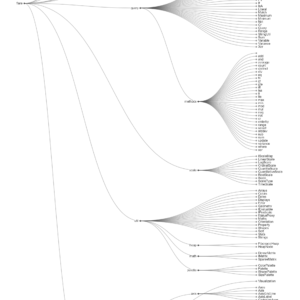
The “US Population by State 1790-1990” chart is a historical data visualization tool that illustrates the population distribution across various states of the United States over a two-century period. Typically, this chart utilizes a line graph or bar graph format, with each state represented by a distinct color or marker. The horizontal axis typically represents the years from 1790 to 1990, while the vertical axis denotes population counts or percentages. By plotting the population data for each state over time, the chart provides a comprehensive view of population growth, migration patterns, and demographic changes across different regions of the country. This visualization tool is valuable for understanding the historical evolution of population dynamics within the United States, including factors such as westward expansion, urbanization, industrialization, immigration, and internal migration trends. Additionally, the chart may include annotations or labels to highlight significant events or milestones in American history that influenced population trends, such as the Louisiana Purchase, the California Gold Rush, or the Civil Rights Movement. Overall, the “US Population by State 1790-1990” chart serves as a valuable resource for researchers, historians, policymakers, and the general public interested in exploring the demographic history of the United States and its individual states over the past two centuries.
Uses:
- Historical Analysis: Researchers and historians use these charts to analyze population trends and demographic changes in individual states over the past two centuries.
- Educational Purposes: These charts serve as educational tools in schools and universities to teach students about the history of population distribution and migration patterns in the United States.
- Policy Development: Policymakers utilize these charts to inform policy decisions related to issues such as infrastructure development, resource allocation, and social services planning based on population distribution.
- Economic Analysis: Economists analyze these charts to understand the impact of population growth or decline on regional economies, employment trends, and consumer markets.
- Urban Planning: Urban planners use these charts to study population shifts and migration patterns to inform city planning and development strategies, such as housing, transportation, and public services.
- Business Strategy: Businesses use population data to identify target markets, evaluate expansion opportunities, and make strategic decisions related to location, marketing, and product development.
- Community Development: Community organizations and nonprofits utilize these charts to assess community needs, advocate for resources, and plan programs and services to address population-related challenges.
- Genealogical Research: Individuals interested in genealogy use these charts to trace family histories and understand migration patterns of their ancestors across different states over time.
- Public Health Planning: Public health officials use population data to assess healthcare needs, plan disease prevention programs, and allocate resources for healthcare services based on demographic trends.
- Tourism Planning: Tourist agencies and destination marketers use population data to identify tourist preferences, plan marketing campaigns, and develop tourism infrastructure based on population demographics.
Purposes:
- Visualizing Population Trends: The primary purpose of these charts is to visualize and analyze population trends and changes in individual states across different time periods.
- Identifying Migration Patterns: They help identify migration patterns, including movements of populations within states, between states, and from rural to urban areas, over the years.
- Comparing State Populations: These charts facilitate comparisons of population sizes and growth rates among different states to understand regional variations in population dynamics.
- Tracking Population Growth: They track population growth or decline in individual states over time, providing insights into factors driving population changes, such as births, deaths, and migration.
- Examining Demographic Shifts: They examine demographic shifts, such as changes in age distribution, racial and ethnic composition, and household characteristics, within states over time.
- Highlighting Historical Events: These charts highlight historical events or developments that have influenced population trends, such as wars, economic booms or recessions, and legislative changes.
- Understanding Urbanization: They help understand the process of urbanization and suburbanization by tracking population shifts from rural to urban areas and the growth of metropolitan regions.
- Exploring Social Dynamics: These charts explore social dynamics, such as the impact of immigration, settlement patterns, and cultural diversity, on population distribution within states.
- Informing Policy Decisions: They provide data to inform policy decisions related to issues such as education, healthcare, housing, and transportation planning based on population trends.
- Supporting Research and Analysis: These charts support research and analysis in various fields, including sociology, geography, economics, and public policy, by providing historical population data for analysis and interpretation.
Only logged in customers who have purchased this product may leave a review.
Related products
-
- Sale!
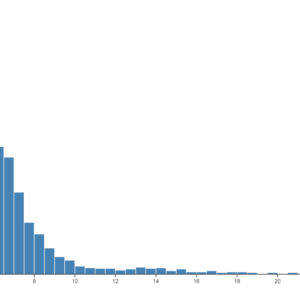
Histogram
- Original price was: $ 15.$ 10Current price is: $ 10.
- Add to cart
-
- Sale!
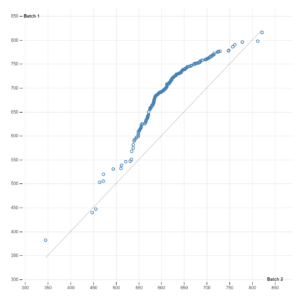
Q-Q Plot
- Original price was: $ 15.$ 10Current price is: $ 10.
- Add to cart
-
- Sale!
Clustre Dendogram
- Original price was: $ 15.$ 10Current price is: $ 10.
- Add to cart
Reviews
There are no reviews yet.