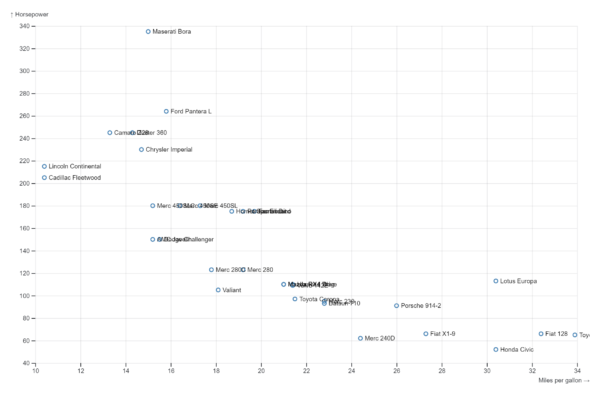
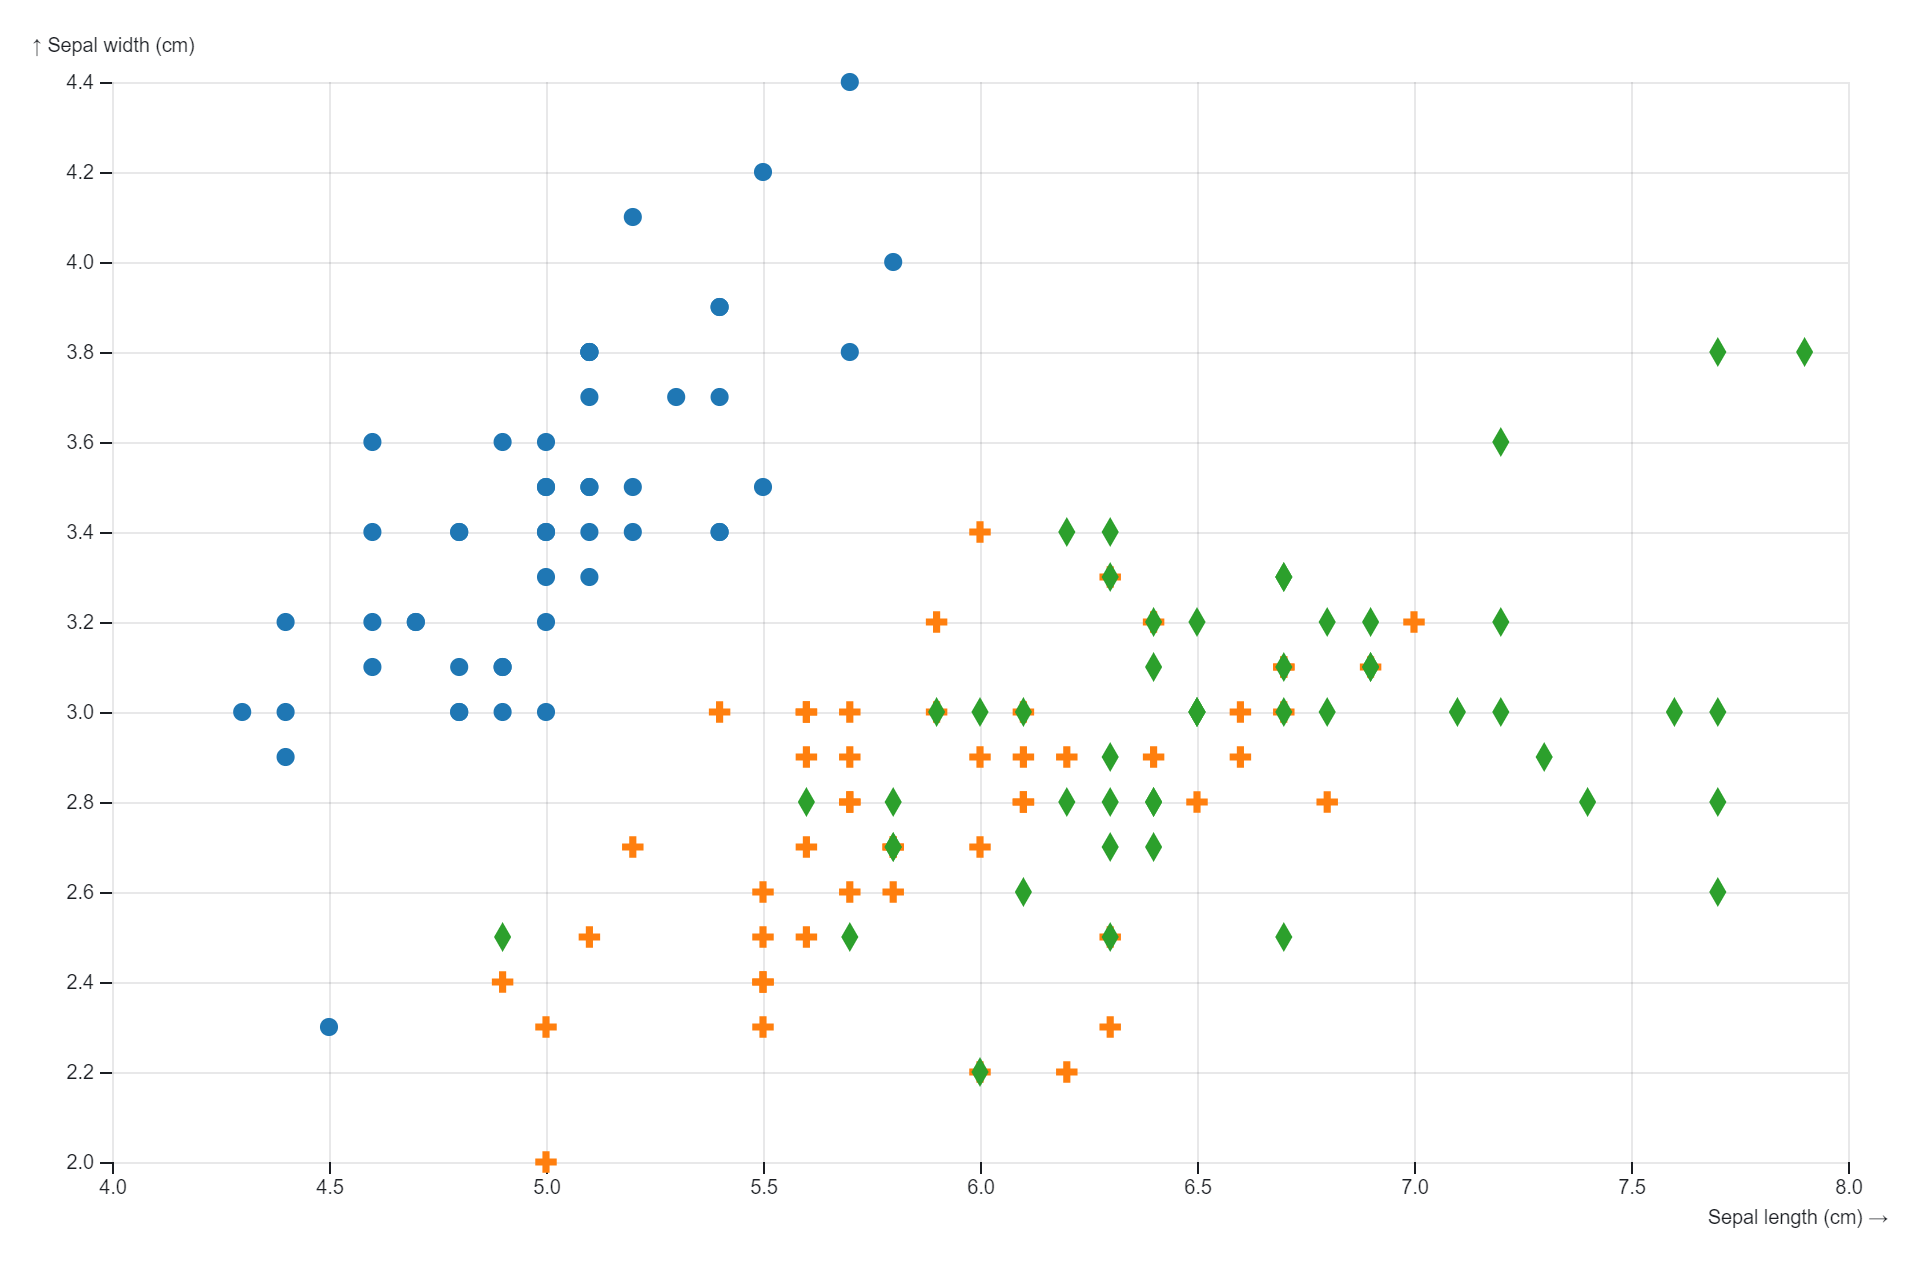
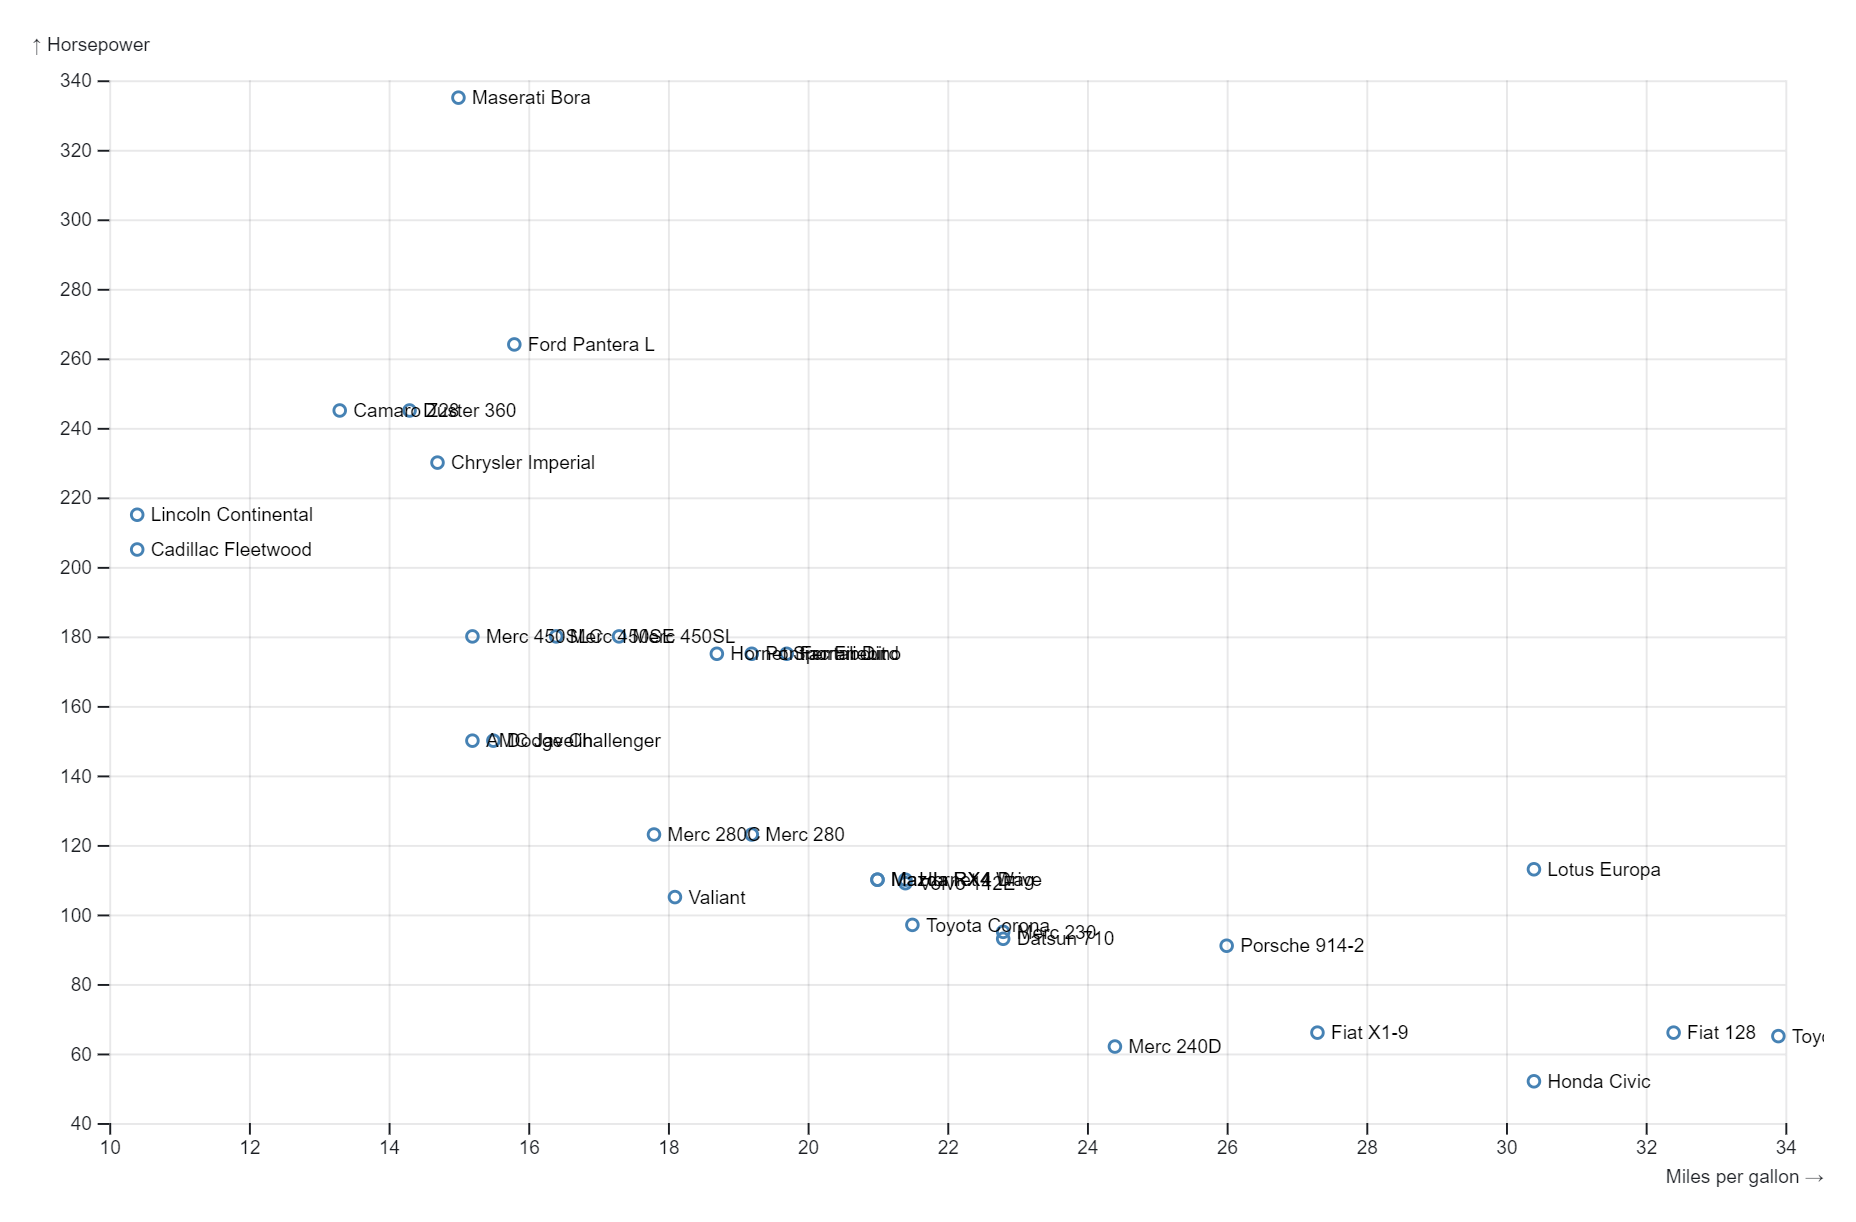
Sale!

Scatterplot

Original price was: $ 15.Current price is: $ 10.

Description

A scatterplot is a simple yet powerful visualization tool that displays individual data points as dots on a two-dimensional grid. It helps visualize the relationship between two variables by plotting one variable on the horizontal axis and the other on the vertical axis. This allows for the quick identification of patterns, trends, correlations, and outliers within the dataset. Scatterplots are commonly used in exploratory data analysis, allowing analysts to gain insights into the data distribution and identify any relationships between variables at a glance.

Purposes :

The purposes of a scatterplot include:

  1. Visualizing Relationships: Scatterplots are used to visually display the relationship between two variables, helping to identify patterns, trends, and correlations within the data.
  2. Identifying Trends: They help in identifying any systematic trends or patterns in the data by examining the overall distribution of data points on the plot.
  3. Assessing Correlations: Scatterplots are valuable for assessing the strength and direction of the relationship between two variables, allowing users to determine if there is a positive, negative, or no correlation.
  4. Detecting Outliers: They aid in detecting outliers or unusual data points that may deviate significantly from the overall pattern of the data, providing insights into potential errors or interesting phenomena.
  5. Comparing Variables: Scatterplots enable the comparison of two variables, facilitating the understanding of how changes in one variable may affect the other.
  6. Exploratory Data Analysis: They serve as essential tools for exploratory data analysis, allowing analysts to explore the structure of the data, identify potential associations, and generate hypotheses for further investigation.
  7. Communicating Insights: Scatterplots help in communicating insights and findings from data analysis to stakeholders or audiences in a clear, concise, and visually appealing manner.
  8. Supporting Statistical Analysis: They provide a visual aid for statistical analysis, allowing analysts to visually inspect the distribution of data points and assess assumptions required for statistical tests or models.
  9. Making Predictions: Scatterplots can be used to assess the suitability of a model for making predictions by examining how well the model fits the observed data points.
  10. Informing Decision-Making: They assist in informing decision-making processes by providing visual evidence and insights derived from the analysis of relationships between variables.

Uses :

Here are some common uses of scatterplots:

  1. Visualizing Relationships: Scatterplots are used to visually display the relationship between two variables, helping to identify patterns, trends, and correlations within the data.
  2. Identifying Trends: They help in identifying any systematic trends or patterns in the data by examining the overall distribution of data points on the plot.
  3. Assessing Correlations: Scatterplots are valuable for assessing the strength and direction of the relationship between two variables, allowing users to determine if there is a positive, negative, or no correlation.
  4. Detecting Outliers: They aid in detecting outliers or unusual data points that may deviate significantly from the overall pattern of the data, providing insights into potential errors or interesting phenomena.
  5. Comparing Variables: Scatterplots enable the comparison of two variables, facilitating the understanding of how changes in one variable may affect the other.
  6. Exploratory Data Analysis: They serve as essential tools for exploratory data analysis, allowing analysts to explore the structure of the data, identify potential associations, and generate hypotheses for further investigation.
  7. Communicating Insights: Scatterplots help in communicating insights and findings from data analysis to stakeholders or audiences in a clear, concise, and visually appealing manner.
  8. Supporting Statistical Analysis: They provide a visual aid for statistical analysis, allowing analysts to visually inspect the distribution of data points and assess assumptions required for statistical tests or models.
  9. Making Predictions: Scatterplots can be used to assess the suitability of a model for making predictions by examining how well the model fits the observed data points.
  10. Informing Decision-Making: They assist in informing decision-making processes by providing visual evidence and insights derived from the analysis of relationships between variables.

Overall, scatterplots are versatile tools that can be used across various fields, including statistics, data science, social sciences, economics, and more, to gain insights from data and inform decision-making processes.

Reviews

There are no reviews yet.

Only logged in customers who have purchased this product may leave a review.