Sale!

Spike map

Original price was: $ 15.Current price is: $ 10.

Description

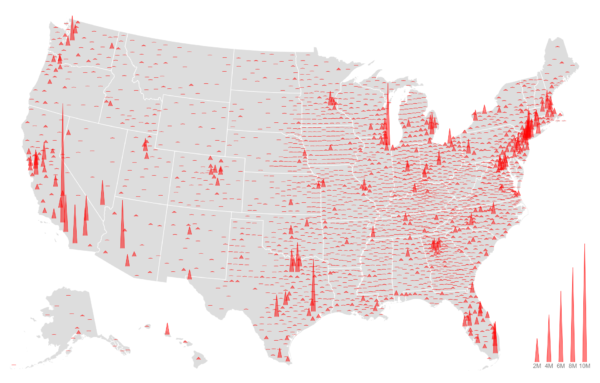
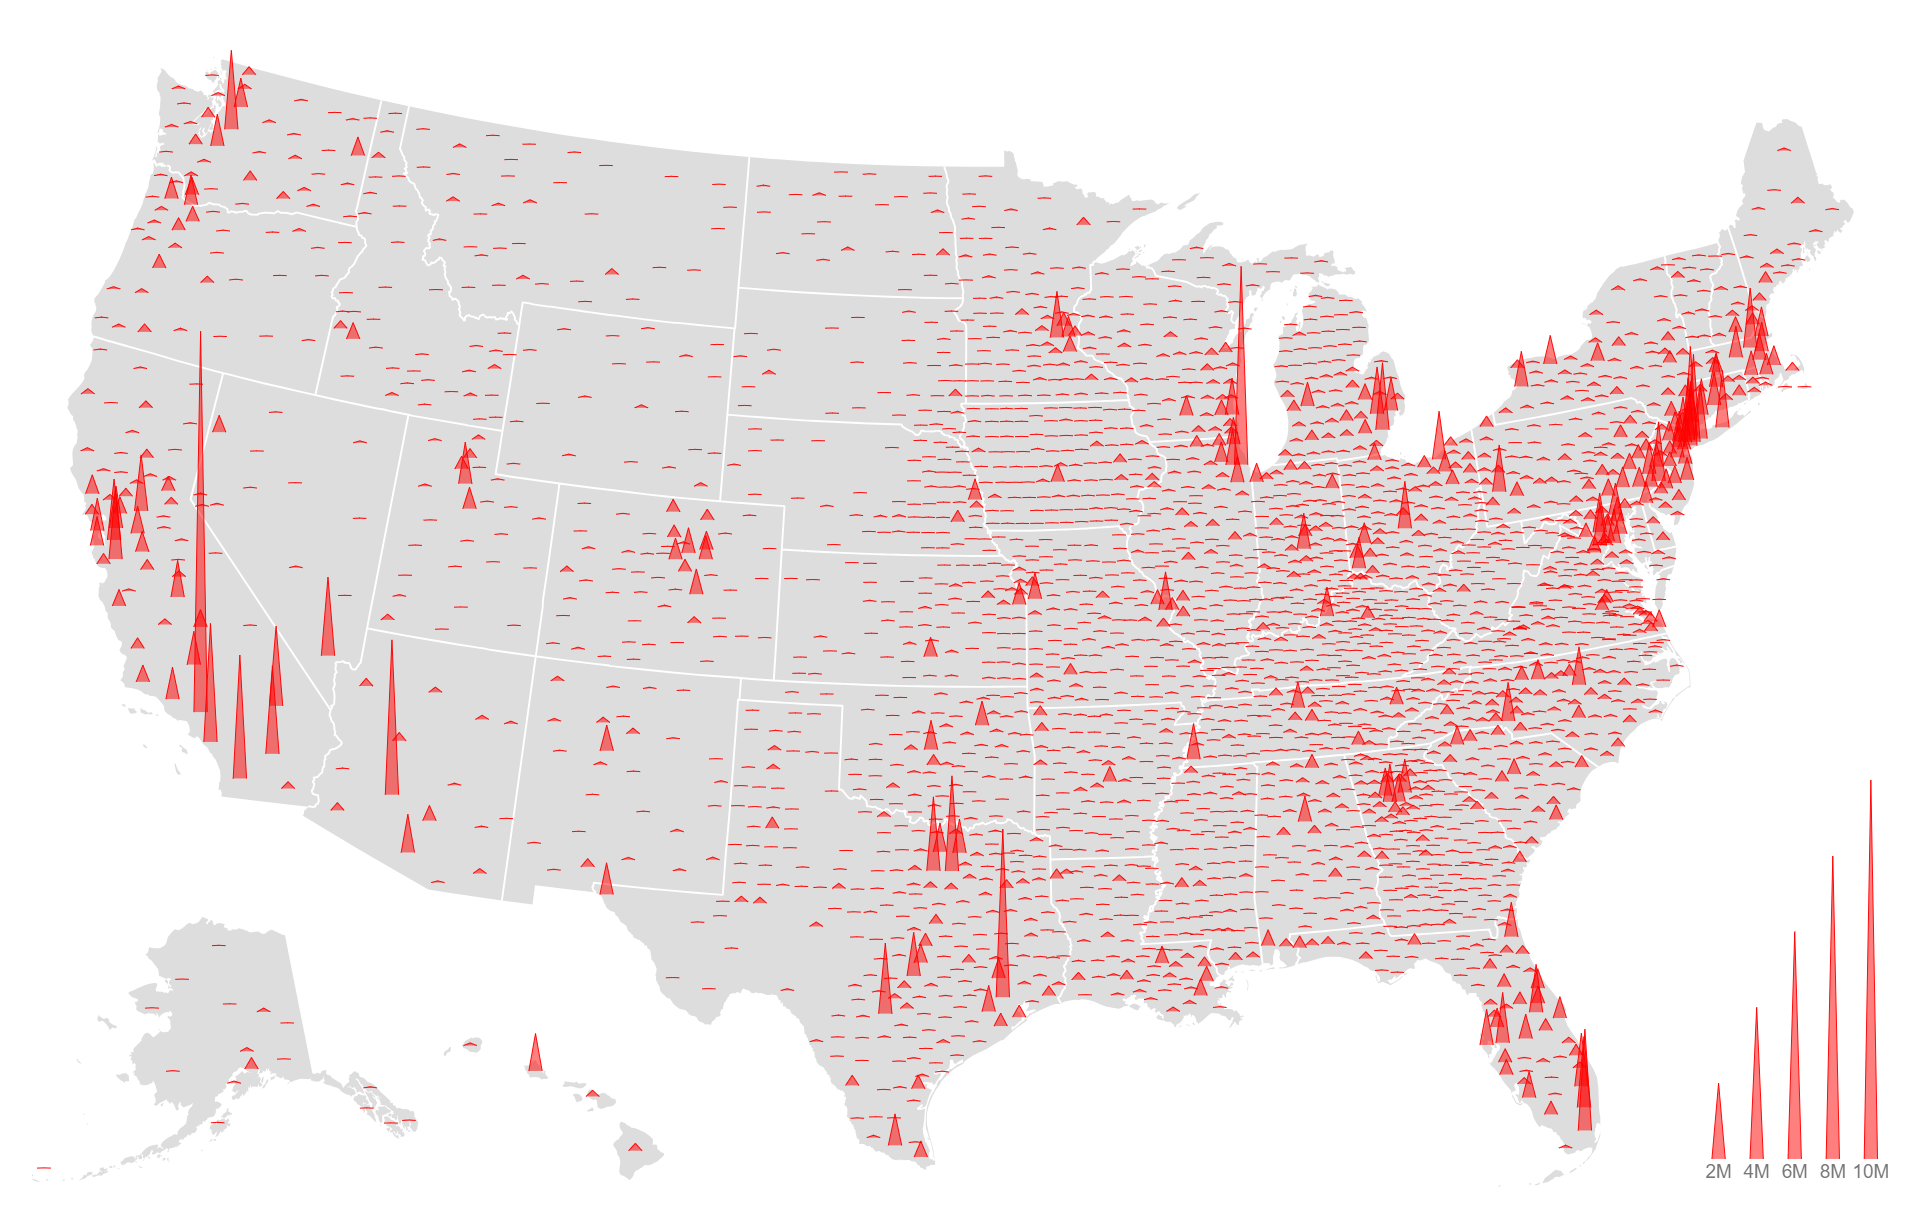
A spike map is a type of data visualization that represents geographic information by using spikes or vertical lines to convey data values at specific locations on a map. Each spike typically represents a numerical value, such as population density, frequency of events, or any other relevant metric. The height or length of each spike corresponds to the magnitude of the data value at its respective location. Spike maps allow for the visualization of spatial patterns and variations in data across different regions or locations. They are commonly used in fields such as geography, demographics, and data analysis to analyze and communicate spatial data effectively.

Purposes :

The purposes of a spike map using D3.js include:

  1. Geospatial Visualization: Spike maps serve as a means to visually represent geospatial data by placing spikes or vertical lines at specific locations on a map, providing a spatial context for the data.
  2. Identifying Hotspots and Clusters: They help in identifying hotspots, clusters, and concentrations of data points within a geographic area, aiding in the detection of spatial patterns and anomalies.
  3. Analyzing Spatial Trends: Spike maps facilitate the analysis of spatial trends and variations within a geographic area by visually inspecting the density and distribution of spikes, allowing users to understand spatial relationships and trends.
  4. Highlighting Point Data: They are effective for highlighting point data such as locations of events, occurrences, or measurements, providing a visual representation of where specific events or phenomena are concentrated geographically.
  5. Supporting Decision-Making: Spike maps provide spatial context to data, enabling stakeholders to make informed decisions based on insights gained from visualizing the geographic distribution of data points.
  6. Communicating Geographic Insights: They serve as effective communication tools for presenting geographic insights and findings to stakeholders or audiences in a clear, concise, and visually appealing manner, facilitating understanding and interpretation of spatial data.
  7. Exploring Geographic Data: Spike maps allow for the exploration and analysis of geographic data by providing an interactive visualization platform where users can interactively explore the density and distribution of spikes across different geographic regions.
  8. Comparing Spatial Patterns: Spike maps enable users to compare spatial patterns and distributions between different datasets or time periods, allowing for the identification of changes, trends, or correlations in geographic data over time or across different variables.
  9. Enhancing Geographic Understanding: They help enhance understanding of geographic phenomena and processes by providing a visual representation of spatial data, enabling users to gain insights into the geographic distribution and dynamics of various phenomena.
  10. Spatial Data Integration: Spike maps can be integrated with other geospatial datasets or visualizations to provide a comprehensive view of geographic information and support more in-depth analysis and exploration of spatial data.

Uses :

Here are some common uses of spike map  charts:

  1. Geospatial Analysis: Spike maps are used to analyze and visualize geospatial data, allowing users to identify spatial patterns, trends, and relationships.
  2. Point Data Visualization: They are effective for visualizing point data such as event locations, sensor readings, or geographical measurements, providing a spatial context for the data.
  3. Identifying Hotspots and Clusters: Spike maps help in identifying hotspots, clusters, or concentrations of data points within a geographic area, aiding in the detection of spatial patterns and anomalies.
  4. Spatial Trend Analysis: They facilitate the analysis of spatial trends and variations within a geographic area by visually inspecting the density and distribution of spikes, enabling users to understand spatial relationships and trends.
  5. Supporting Decision-Making: Spike maps provide spatial context to data, enabling stakeholders to make informed decisions based on insights gained from visualizing the geographic distribution of data points.
  6. Communicating Geographical Insights: They serve as effective communication tools for presenting geographical insights and findings to stakeholders or audiences in a clear, concise, and visually appealing manner, facilitating understanding and interpretation of spatial data.
  7. Exploring Geographic Data: Spike maps allow for the exploration and analysis of geographic data by providing an interactive visualization platform where users can interactively explore the density and distribution of spikes across different geographic regions.
  8. Comparing Spatial Patterns: Spike maps enable users to compare spatial patterns and distributions between different datasets or time periods, allowing for the identification of changes, trends, or correlations in geographic data over time or across different variables.
  9. Spatial Data Integration: They can be integrated with other geospatial datasets or visualizations to provide a comprehensive view of geographic information and support more in-depth analysis and exploration of spatial data.
  10. Geographical Reporting: Spike maps are used for reporting and presenting geographical data and insights in research papers, reports, presentations, and publications, providing a visual representation of spatial phenomena and findings.

Reviews

There are no reviews yet.

Only logged in customers who have purchased this product may leave a review.