A bar chart is a graphical representation of data that uses rectangular bars of varying lengths to show the relative magnitude or frequency of different categories or groups. The length of each bar typically corresponds to the numerical value it represents, making it easy to compare values across categories visually. Bar charts are commonly used to display categorical data, such as sales figures by month, survey responses by category, or population distribution by region. They provide a clear and straightforward way to visualize data and identify patterns or trends at a glance.
Purposes :
Bar charts serve several important purposes in data visualization and analysis:
Comparison: Bar charts are widely used to compare the values of different categories or groups. They make it easy to see differences in magnitude or frequency between distinct data points, helping users quickly identify patterns or trends.
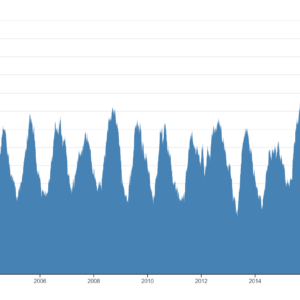
Trend Analysis: Bar charts can display trends over time by plotting data points for each time period along the horizontal axis. This allows for visualizing changes or patterns over time, such as monthly sales trends, quarterly revenue growth, or annual population changes.
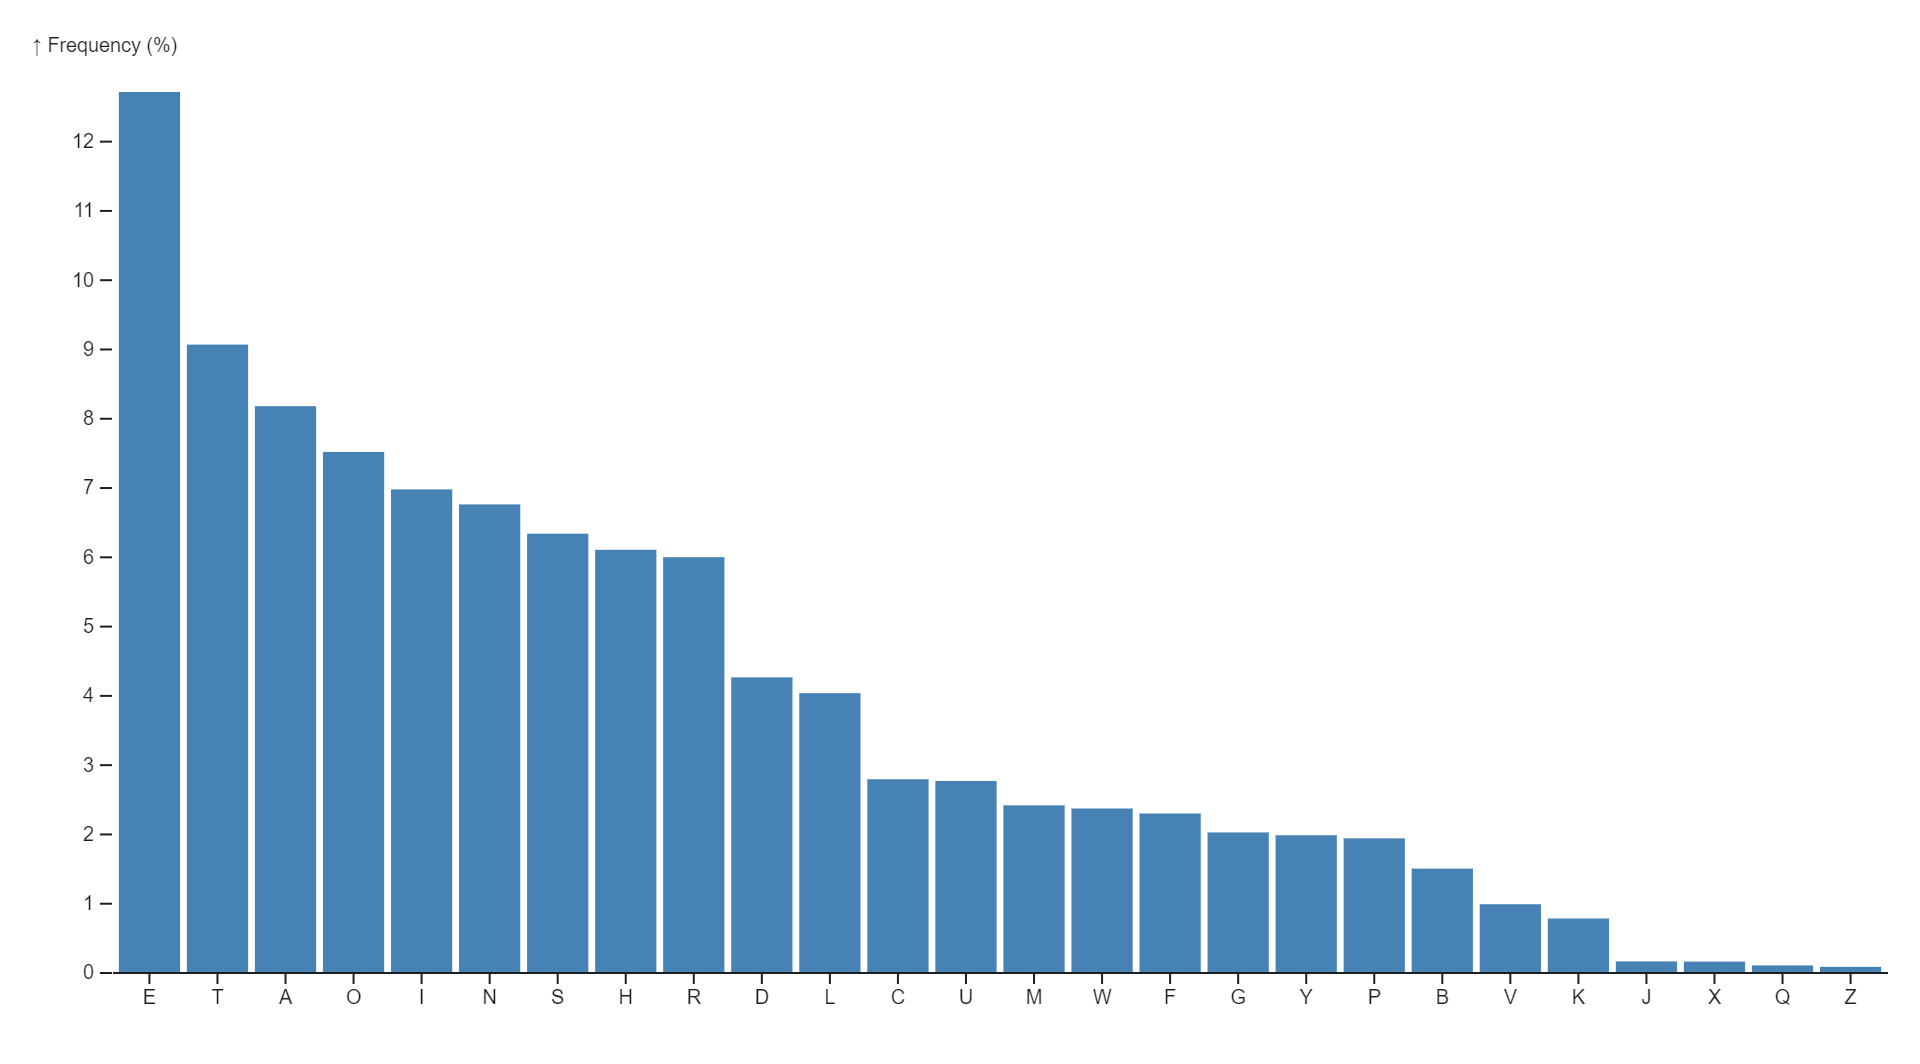
Distribution Display: Bar charts are effective for displaying the distribution of data within a category or group. They can illustrate the frequency distribution of responses to a survey question, the age distribution of a population, or the distribution of scores in an exam.
Ranking: Bar charts can be used to rank categories or groups based on their values. This is useful for identifying top performers, highest-selling products, most populous cities, or any other ranked data.
Part-to-Whole Relationships: Bar charts can represent part-to-whole relationships by stacking bars on top of each other or by using grouped bars. This helps visualize the composition of a whole, such as the distribution of expenses in a budget or the market share of different companies.
Performance Monitoring: Bar charts are effective for monitoring performance against targets or benchmarks. By comparing actual performance to predefined goals, organizations can easily identify areas of success or areas needing improvement.
Decision Making: Bar charts facilitate data-driven decision-making by providing a visual representation of data. They enable decision-makers to quickly interpret and analyze information, aiding in identifying opportunities, allocating resources, and devising strategies.
Communication: Bar charts are commonly used in presentations, reports, and publications due to their simplicity and effectiveness in communicating data. They provide a visually appealing way to convey information to audiences, making complex data more understandable.
Overall, bar charts are a versatile tool in data visualization, serving multiple purposes across various fields and contexts, from business analytics and market research to scientific studies and academic research.
Uses :
Bar charts have numerous applications across various fields due to their simplicity and effectiveness in visualizing data. Some common uses of bar charts include:
Comparing Data: Bar charts are excellent for comparing data between different categories or groups. For instance, comparing sales figures of different products, comparing performance metrics of different teams, or comparing the population of different cities.
Trend Analysis: Bar charts can display trends over time by plotting data points for each time period along the horizontal axis. This allows for easy visualization of changes or patterns over time, such as monthly sales trends, quarterly revenue growth, or annual temperature fluctuations.
Frequency Distribution: Bar charts can represent the frequency distribution of categorical data. They are useful for showing the distribution of responses to a survey question, the distribution of age groups in a population, or the distribution of product defects by type.
Ranking: Bar charts can be used to rank items based on their values. This is helpful for identifying top performers, highest-selling products, most populous countries, or any other ranked data.
Part-to-Whole Comparison: Bar charts can illustrate the composition of a whole by showing the parts that make it up. For example, showing the distribution of expenses in a budget, the market share of different companies, or the contribution of each department to overall revenue.
Performance Monitoring: Bar charts are useful for monitoring performance against targets or benchmarks. By comparing actual performance to predefined goals, organizations can easily identify areas of success or areas needing improvement.
Decision Making: Bar charts facilitate data-driven decision-making by providing a visual representation of data. They help decision-makers quickly understand trends, patterns, and relationships in the data, enabling them to make informed decisions.
Presentation and Reporting: Bar charts are commonly used in presentations, reports, and publications because of their simplicity and clarity. They provide an easy-to-understand visual summary of data, making complex information more accessible to audiences.
Overall, bar charts are a versatile tool for visualizing and analyzing data in various contexts, from business and finance to science and academia. They help communicate information effectively, identify trends and patterns, and support decision-making processes.
Reviews
There are no reviews yet.
Only logged in customers who have purchased this product may leave a review.


Reviews
There are no reviews yet.