Sale!

Centerline Labeling

Original price was: $ 15.Current price is: $ 10.

Description

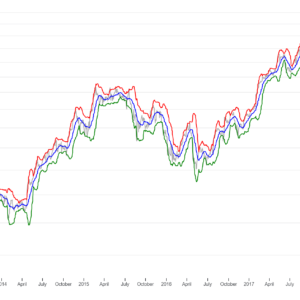
A centerline labeling chart is a graphical tool that shows the variation of a process over time, using a centerline as a reference point. The centerline represents the average or target value of the process, and the data points are plotted around it. The chart can also include upper and lower control limits, which indicate the acceptable range of variation for the process.

Purposes :

  1. Monitoring Process Stability: Centerline charts help monitor the central tendency of a process over time. By displaying the mean or target value as a centerline, they allow operators to quickly assess whether the process is stable or experiencing significant shifts.
  2. Detecting Process Variation: Changes or shifts in process variation can indicate potential problems or opportunities for improvement. Centerline charts enable operators to detect variations in data points relative to the centerline, helping to identify sources of variability and take corrective actions.
  3. Identifying Trends and Patterns: Centerline charts facilitate the identification of trends, patterns, or cycles in process data. By analyzing the direction and magnitude of data points relative to the centerline, operators can uncover underlying patterns that may signal systematic changes in the process.
  4. Setting Process Control Limits: Centerline charts are used to establish upper and lower control limits around the centerline, which define the acceptable range of variation for the process. These control limits help distinguish between common cause variation (inherent to the process) and special cause variation (indicative of assignable factors requiring investigation).
  5. Facilitating Decision-Making: Centerline charts provide a visual representation of process performance, allowing operators and decision-makers to assess whether the process is meeting desired targets or specifications. This information guides decision-making related to process adjustments, quality control measures, and resource allocation.
  6. Continuous Improvement: By monitoring process performance and identifying areas for improvement, centerline charts support continuous improvement initiatives such as Lean Six Sigma. They provide a basis for data-driven decision-making and help organizations strive for greater efficiency, consistency, and quality in their processes.

Uses :

  1. Enhancing Data Interpretation: Centerline labeling provides clear identification of the central tendency of a process, such as the mean or target value. This aids in interpreting the data by providing a reference point for understanding the overall performance of the process.
  2. Facilitating Visual Analysis: By labeling the centerline on SPC charts, users can easily discern whether data points are above, below, or near the target value. This visual aid streamlines the analysis process, allowing operators to quickly assess whether the process is within acceptable limits.
  3. Improving Communication: Centerline labeling helps communicate important information about process performance to stakeholders, such as operators, supervisors, and management. The presence of a labeled centerline ensures clarity in conveying the intended target or mean value.
  4. Supporting Decision-Making: The labeled centerline assists in making informed decisions regarding process adjustments, quality control measures, or corrective actions. Operators can compare observed data with the target value to determine whether the process is meeting expectations or requires intervention.
  5. Enabling Control Limit Establishment: Centerline labeling is essential for setting control limits around the target value in SPC charts. Control limits define the acceptable range of variation for the process and are crucial for distinguishing between common cause and special cause variation.
  6. Promoting Process Improvement: By providing a visual representation of process performance relative to the target value, centerline labeling supports efforts to identify areas for process improvement. Deviations from the centerline may signal opportunities for optimization or corrective action.


Reviews

There are no reviews yet.

Only logged in customers who have purchased this product may leave a review.