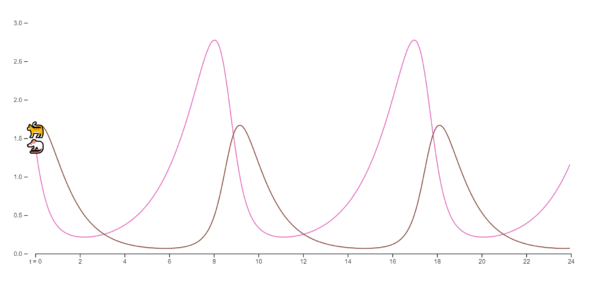
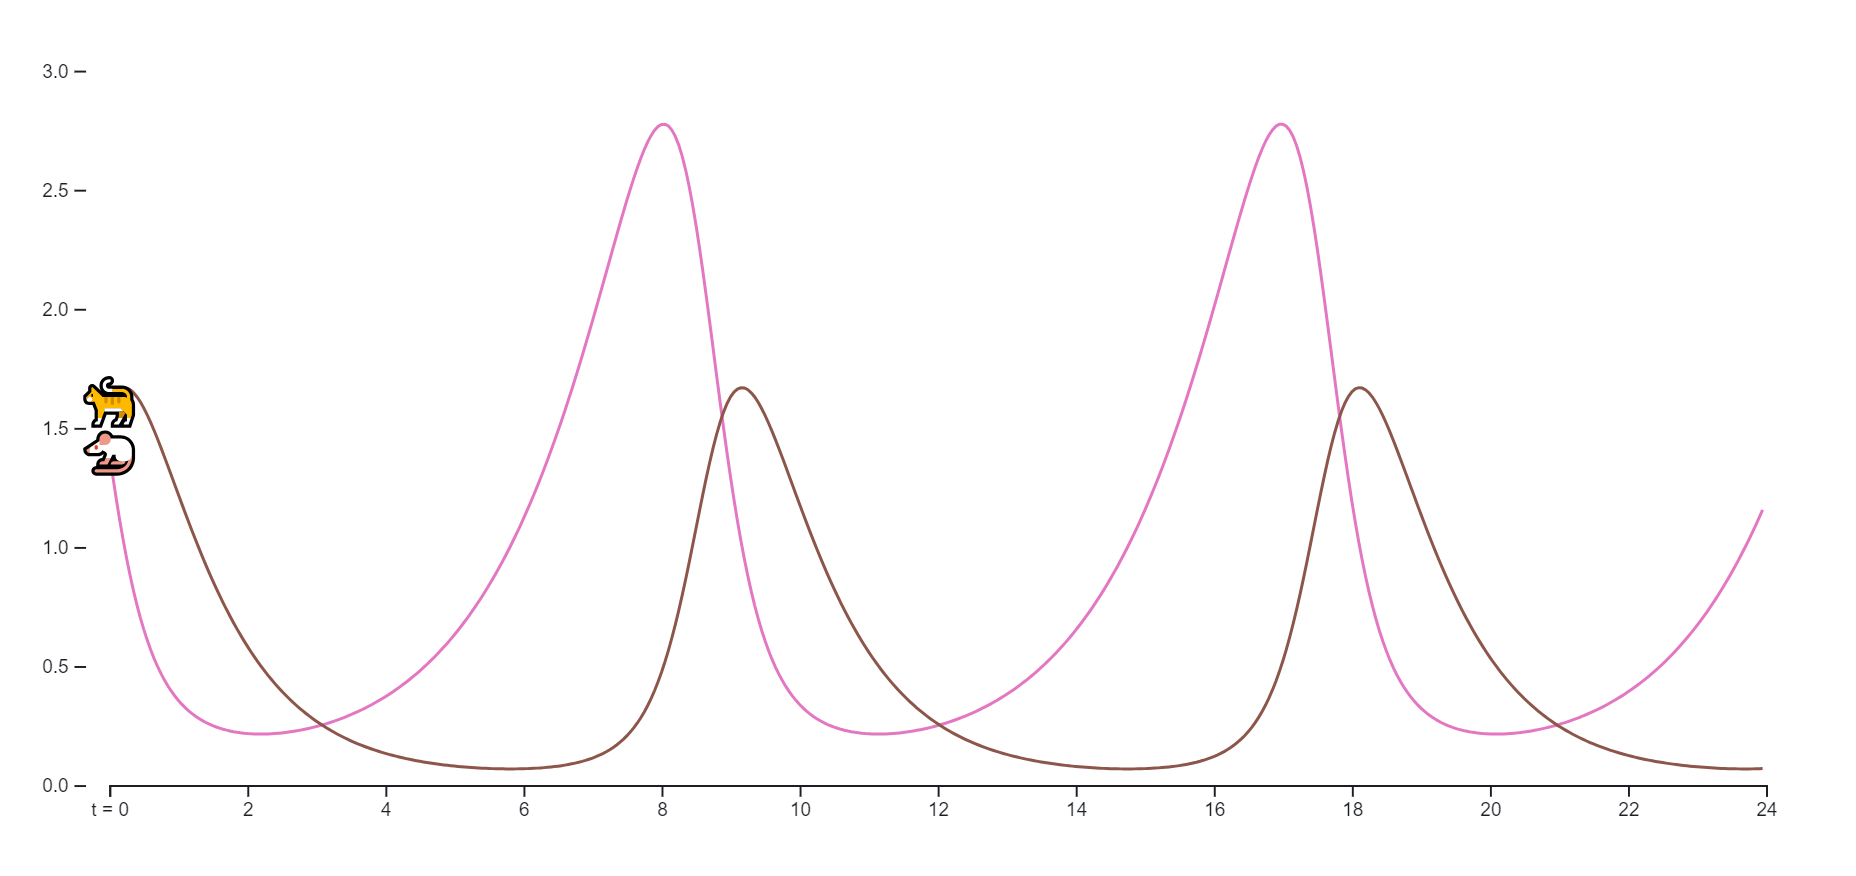
The graph shows that there is almost always more prey than predators. It also shows the following patterns: The number of predators increases when there is more prey. The number of prey reduces when there are more predators. The number of predators reduces when there is less prey.
Purposes :
Predator and prey charts serve several purposes in ecological studies and data visualization:
Visualizing Population Dynamics: They help researchers and students understand the complex interactions between predator and prey populations over time, highlighting patterns of growth, decline, and cyclical fluctuations.
Modeling Ecosystem Stability: By demonstrating how predator and prey populations affect each other, these charts can reveal insights into the stability or instability of ecosystems. Understanding these dynamics is crucial for conservation efforts and managing natural resources.
Predicting Population Trends: These charts can be used to forecast future population trends of predators and prey based on historical data and mathematical models. This predictive capability is valuable for wildlife management and conservation planning.
Educational Tools: Predator and prey charts are frequently used in educational settings to teach students about ecological concepts, such as population dynamics, carrying capacity, and the impacts of predator-prey relationships on ecosystem health.
Comparing Different Ecosystems: By creating predator and prey charts for various ecosystems or species interactions, researchers can compare the dynamics of different ecological systems, helping to identify common patterns or unique characteristics.
Informing Policy and Management: Insights gained from predator and prey charts can inform policy decisions related to wildlife conservation, habitat management, and ecosystem restoration by providing a better understanding of the interactions between species within an ecosystem.
Reviews
There are no reviews yet.
Only logged in customers who have purchased this product may leave a review.
Reviews
There are no reviews yet.