Description
Inline labels in data visualization refer to the practice of directly labeling data points, lines, or other graphical elements within a chart, rather than relying on a separate legend or axis labels. This approach enhances the clarity and readability of the chart by providing immediate context for each data point or element. Inline labels are positioned directly adjacent to the corresponding data points or elements, ensuring that viewers can easily associate each label with its corresponding value or category. By incorporating labels directly into the chart, viewers can quickly interpret and understand the data without the need to refer back and forth between the chart and a legend. Inline labels are particularly useful in charts with multiple data series or complex datasets, where it may be challenging for viewers to differentiate between elements based on color or shape alone. Moreover, inline labels improve accessibility for viewers, particularly those with visual impairments, by providing direct textual information. Overall, inline labels contribute to the clarity, accessibility, and effectiveness of data visualization, making charts more informative and understandable for viewers.
Uses:
- Enhanced Readability: Inline labels improve the readability of charts by providing immediate context for each data point or element.
- Clarity: They make charts clearer and more understandable by associating each label directly with its corresponding data value or category.
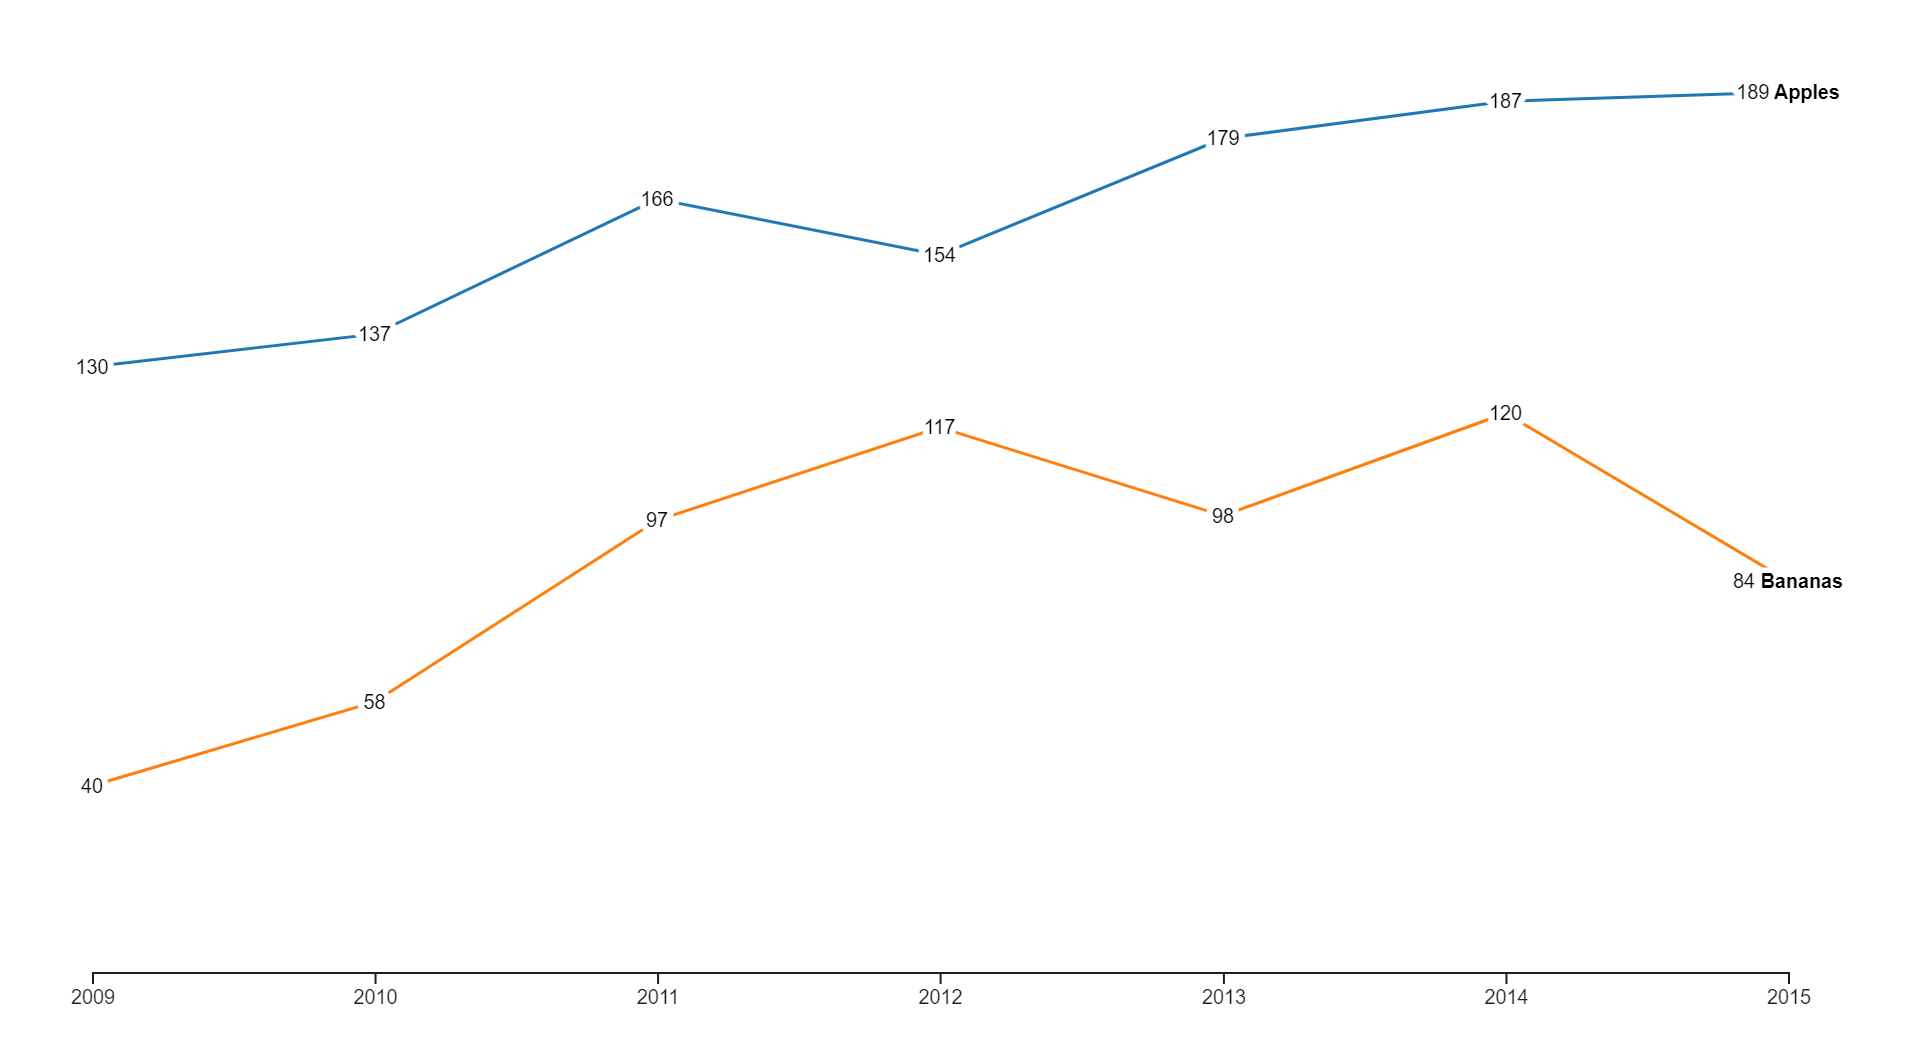
- Facilitated Comparison: Inline labels aid in comparing multiple data points or elements within a chart, making it easier to discern differences between them.
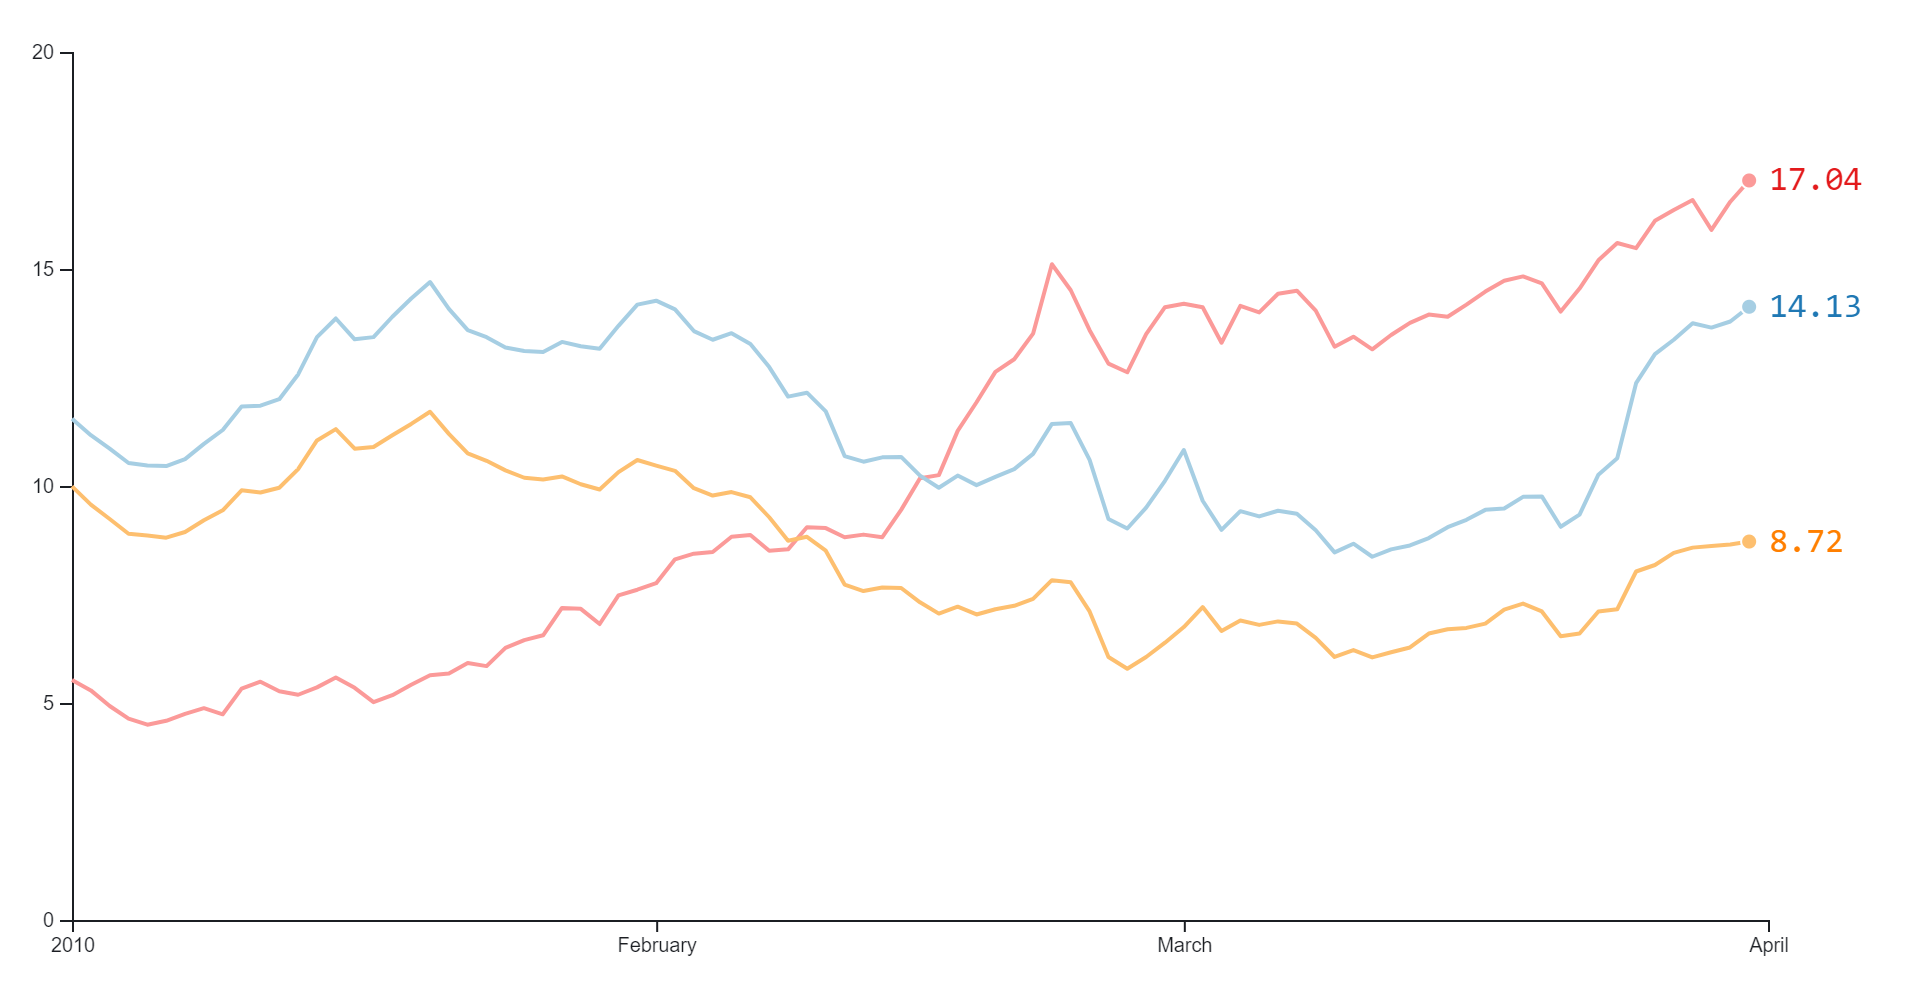
- Highlighting Key Data Points: Inline labels can be used to highlight specific data points or key events, drawing attention to important information within the chart.
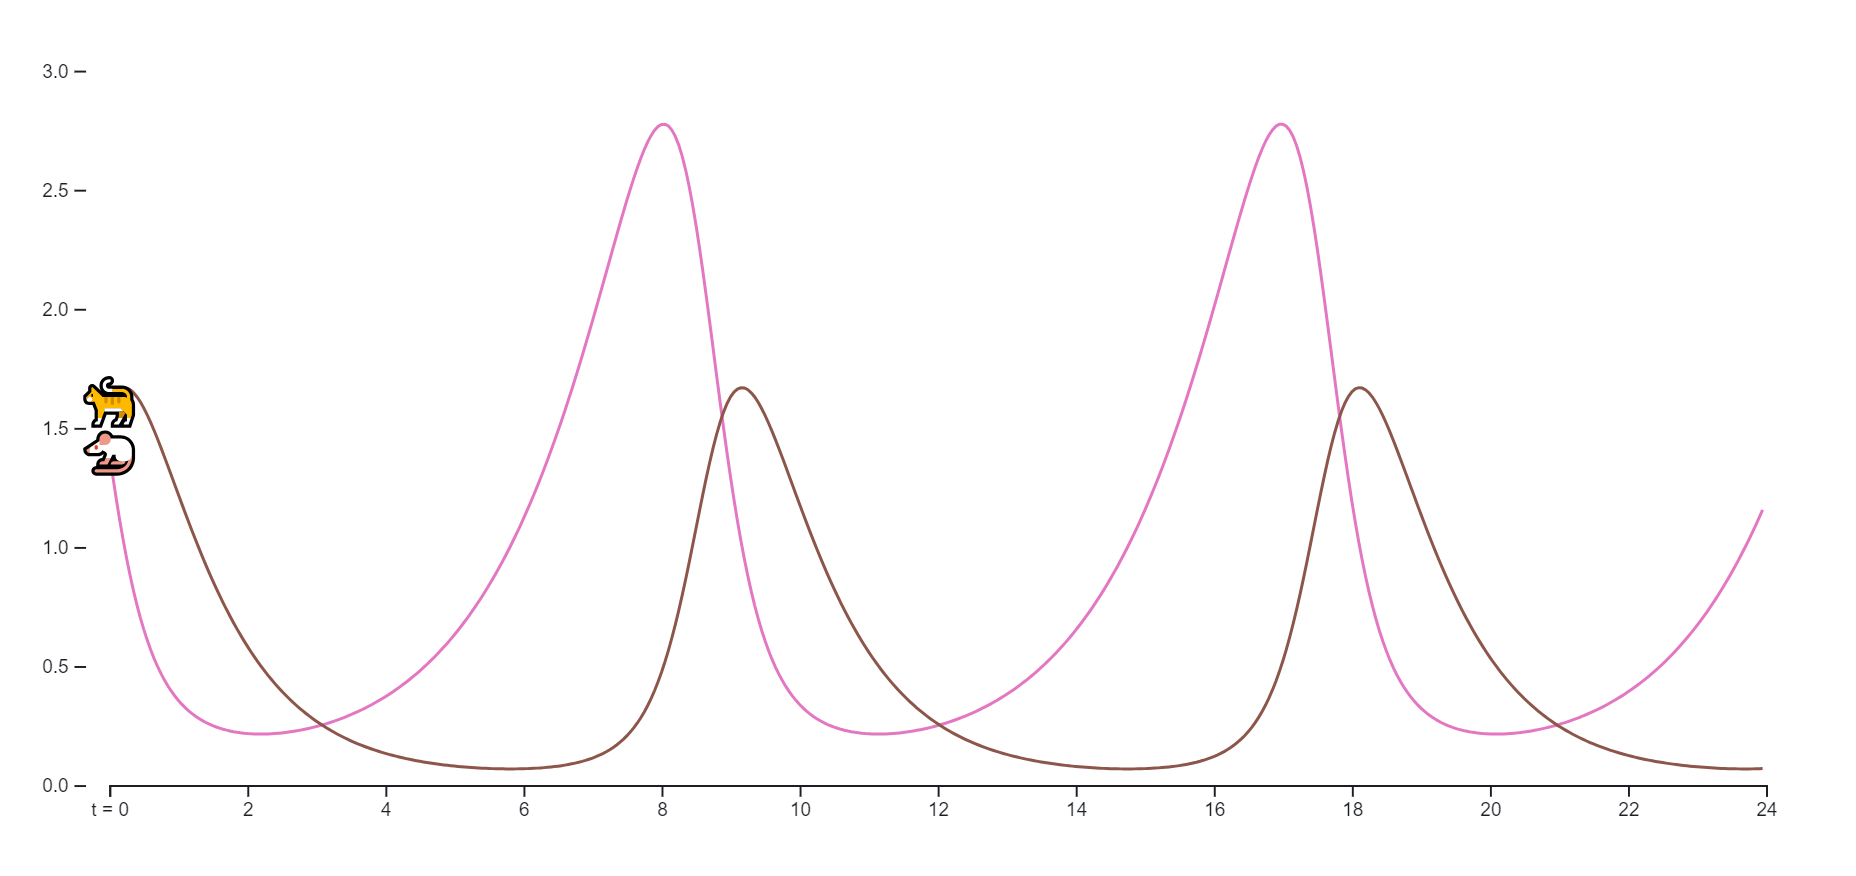
- Navigating Complex Charts: In charts with multiple data series or complex datasets, inline labels help viewers navigate and understand the information more easily.
- Improved Interpretation: Inline labels assist viewers in interpreting changes or patterns within the data, providing context and meaning to the chart’s information.
- Accessibility: They enhance accessibility for viewers, particularly those with visual impairments, by providing direct textual information within the chart.
- Supporting Decision Making: Inline labels provide actionable insights and guidance based on the data, supporting data-driven decision making.
- Engagement: Inline labeled charts engage viewers more effectively by presenting data in a visually appealing and understandable format.
- Communication of Information: Inline labels effectively communicate information to viewers, conveying important data points and trends within the chart.
Purposes:
- Clarity: The primary purpose of inline label charts is to enhance the clarity and understanding of the data presented in the chart.
- Conciseness: Inline labels ensure concise communication of information, avoiding the need for additional legends or annotations.
- Accessibility: Inline label charts improve accessibility for viewers, particularly those with visual impairments, by providing direct textual information within the chart.
- Accuracy: Inline labels contribute to the accuracy of data interpretation by providing clear identification of data points or elements within the chart.
- Efficiency: Inline labeled charts increase the efficiency of data interpretation, allowing viewers to quickly grasp the meaning of each data point or element.
- Facilitation of Analysis: Inline labels facilitate analysis by providing context and meaning to the data, aiding in data-driven decision making.
- Enhanced Presentation: Inline label charts present data in a visually appealing and engaging format, enhancing the overall presentation of the chart.
- Minimization of Ambiguity: Inline labels minimize ambiguity within the chart, ensuring that viewers can easily associate each label with its corresponding data value or category.
- Comparison: Inline labeled charts support comparison between different data points or elements within the chart, enabling viewers to assess differences and similarities more effectively.
- Feedback: Inline labels provide immediate feedback to viewers, guiding their interpretation of the data and facilitating further exploration or analysis.
Only logged in customers who have purchased this product may leave a review.
Related products
-
- Sale!
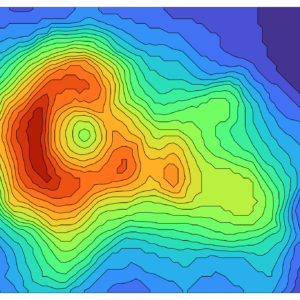
Volcano Contours
- Original price was: $ 15.$ 10Current price is: $ 10.
- Add to cart
-
- Sale!
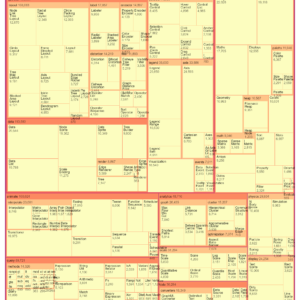
Nested Tree Map
- Original price was: $ 15.$ 10Current price is: $ 10.
- Add to cart
-
- Sale!
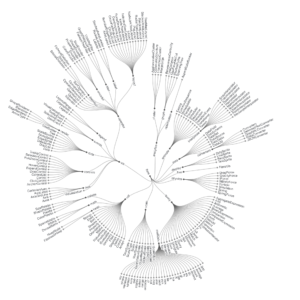
Radial Tidy Tree
- Original price was: $ 15.$ 10Current price is: $ 10.
- Add to cart
Reviews
There are no reviews yet.