Description
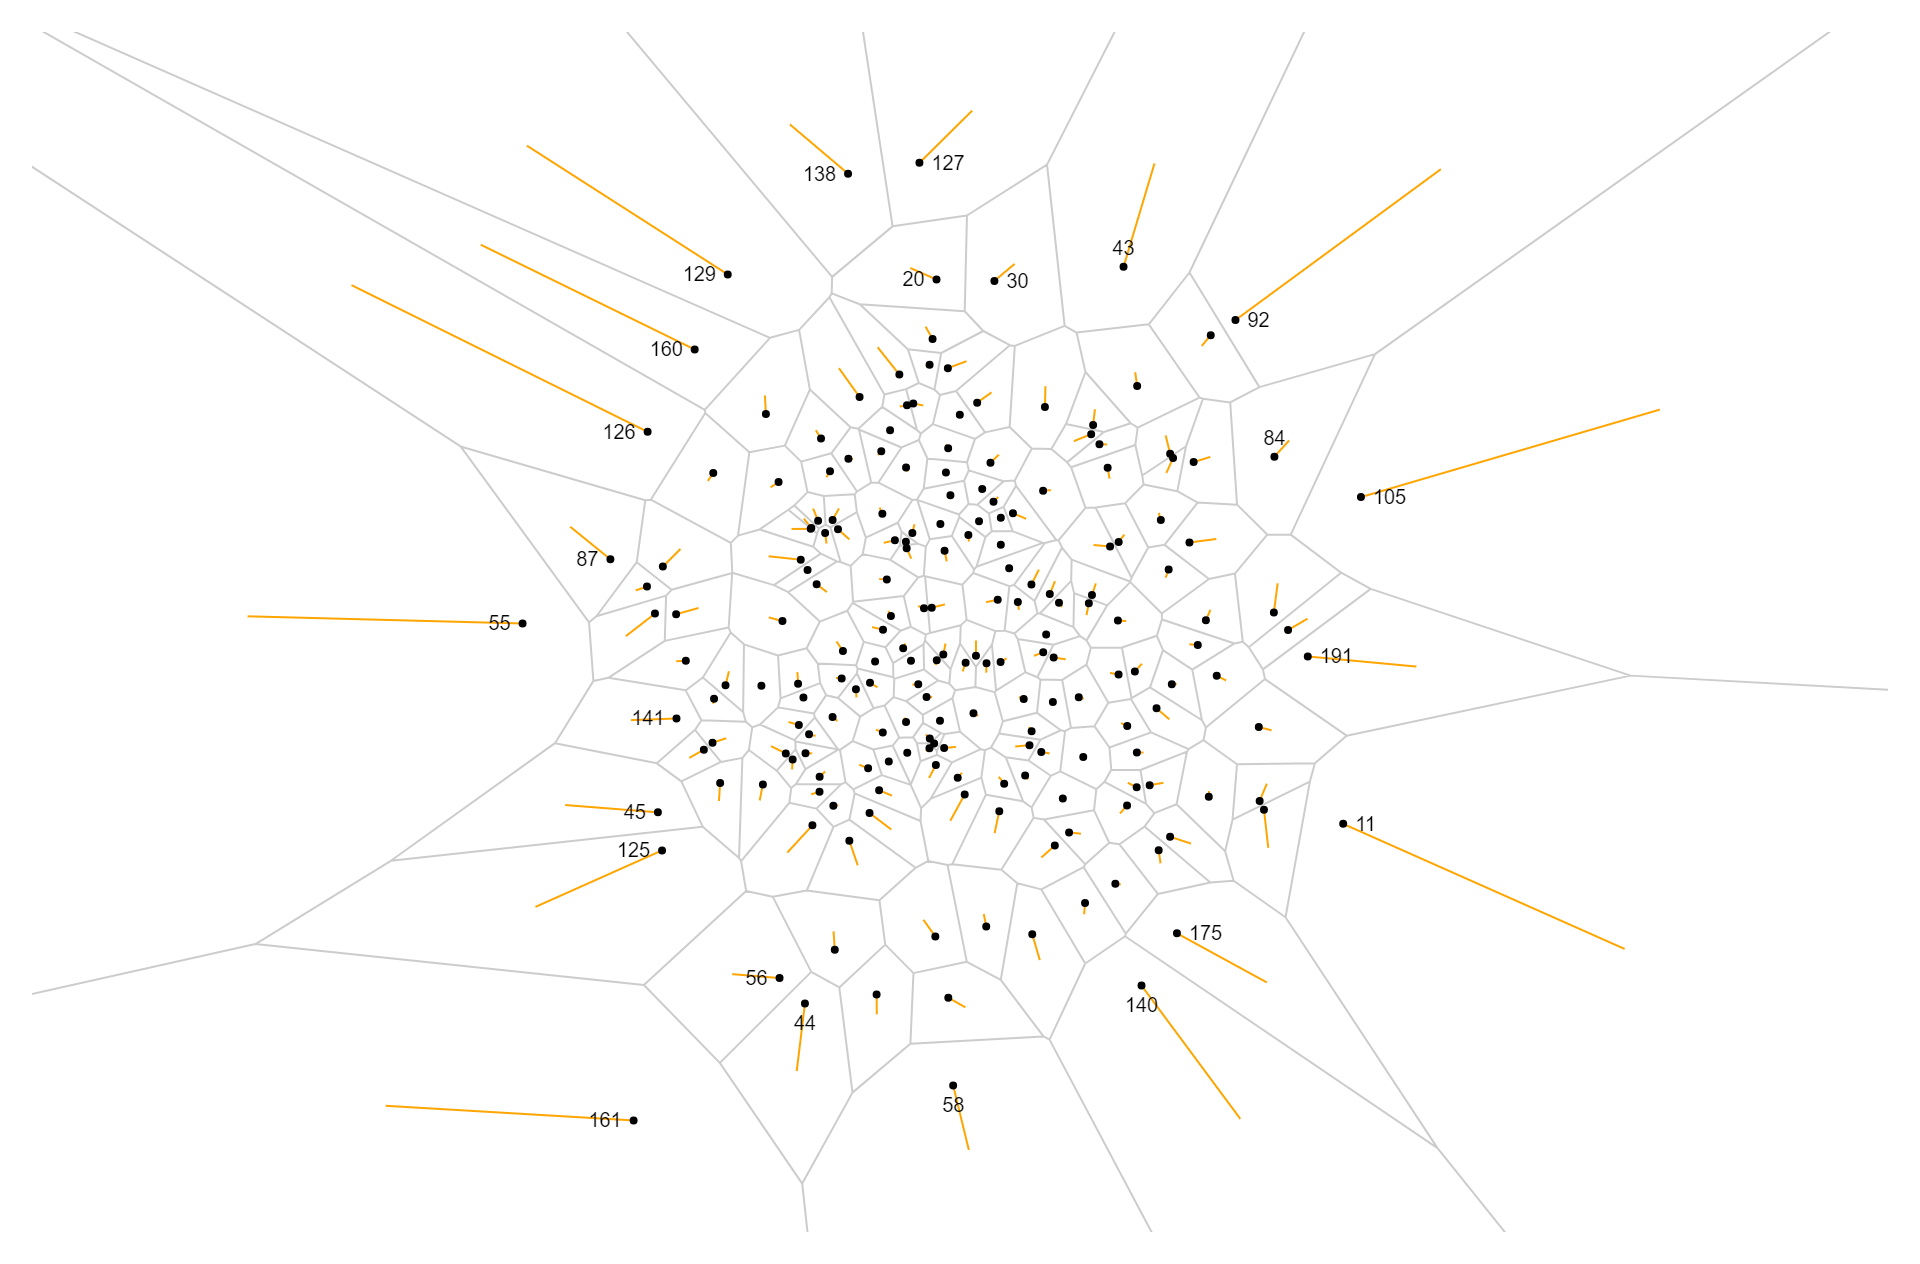
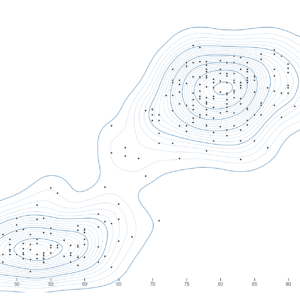
Voronoi labels are a visualization technique used to display data points on a chart while optimizing space and minimizing overlap. Named after mathematician Georgy Voronoi, this method divides the chart into polygonal regions, with each region surrounding a single data point and extending to the nearest neighboring points. Voronoi labels are placed within these regions, typically near the centroid or center, ensuring that each label is associated with its respective data point and positioned in a visually appealing and unobtrusive manner. This approach is particularly useful when dealing with dense datasets or scatter plots where conventional labeling techniques may result in overlapping labels or cluttered visuals. By utilizing Voronoi labels, charts become more readable and interpretable, allowing viewers to quickly identify individual data points and understand their spatial relationships within the dataset. Additionally, Voronoi labels can enhance the aesthetic appeal of the chart, providing a clean and organized presentation of the data. This technique is commonly used in various fields such as data visualization, geography, biology, and astronomy, where accurately representing spatial relationships between data points is essential for analysis and interpretation.
Uses:
- Scatter Plots: Voronoi labels are commonly used in scatter plots to label individual data points, ensuring each point is accurately identified without overlap.
- Map Annotation: They are utilized in map visualizations to label geographical points of interest, such as cities or landmarks, while minimizing label overlap.
- Data Visualization: Voronoi labels aid in visualizing dense datasets by providing clear labeling for each data point, enhancing the interpretability of the chart.
- Network Analysis: In network visualizations, Voronoi labels can be applied to label nodes or vertices, making it easier to identify and analyze network structures.
- Biology and Ecology: Voronoi labels are used in ecological studies to represent territories or habitats of species, allowing researchers to visualize spatial relationships.
- Urban Planning: They are applied in urban planning to visualize and label zones or districts, facilitating analysis of spatial distribution patterns.
- Astronomy: Voronoi labels are used in astronomical studies to label celestial objects or star clusters in sky maps, providing clear identification without overlap.
- Interactive Graphics: In interactive graphics, Voronoi labels allow users to hover over data points and view corresponding labels, enhancing user experience and exploration.
- Machine Learning: Voronoi labels can be utilized in machine learning algorithms for clustering and classification tasks, providing informative labels for each cluster or category.
- Marketing Analysis: They are employed in marketing analysis to visualize customer segmentation or market territories, aiding in targeted marketing strategies.
Purposes:
- Labeling Data Points: The primary purpose of Voronoi labels is to label individual data points in a visualization, providing clear identification and context.
- Overlap Reduction: Voronoi labels help reduce label overlap, ensuring that each label is positioned in a non-overlapping manner, enhancing readability.
- Space Optimization: They optimize space usage in visualizations by efficiently allocating space for each label based on the Voronoi tessellation, minimizing wasted space.
- Enhanced Interpretability: Voronoi labels enhance the interpretability of visualizations by providing clear identification for each data point, aiding in data analysis and understanding.
- Visual Clarity: They improve visual clarity by ensuring that labels are positioned near their respective data points, reducing visual clutter and confusion.
- Geospatial Representation: Voronoi labels aid in geospatial representation by accurately labeling geographical features or points of interest on maps or spatial visualizations.
- Data-driven Insights: They facilitate data-driven insights by providing informative labels that help users understand the significance of individual data points within the dataset.
- User Interaction: Voronoi labels support user interaction by allowing users to hover over data points and view corresponding labels, enhancing engagement and exploration.
- Customization: They offer customization options for label placement and styling, allowing users to tailor the visualization to their specific needs and preferences.
- Efficient Analysis: Voronoi labels streamline data analysis by providing clear and concise labels for each data point, enabling users to focus on insights and patterns within the data.
Only logged in customers who have purchased this product may leave a review.
Related products
-
- Sale!
Clustre Dendogram
- Original price was: $ 15.$ 10Current price is: $ 10.
- Add to cart
-
- Sale!
Density Contours charts
- Original price was: $ 15.$ 10Current price is: $ 10.
- Add to cart
-
- Sale!
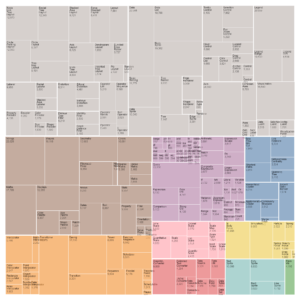
Tree Map
- Original price was: $ 15.$ 10Current price is: $ 10.
- Add to cart
Reviews
There are no reviews yet.