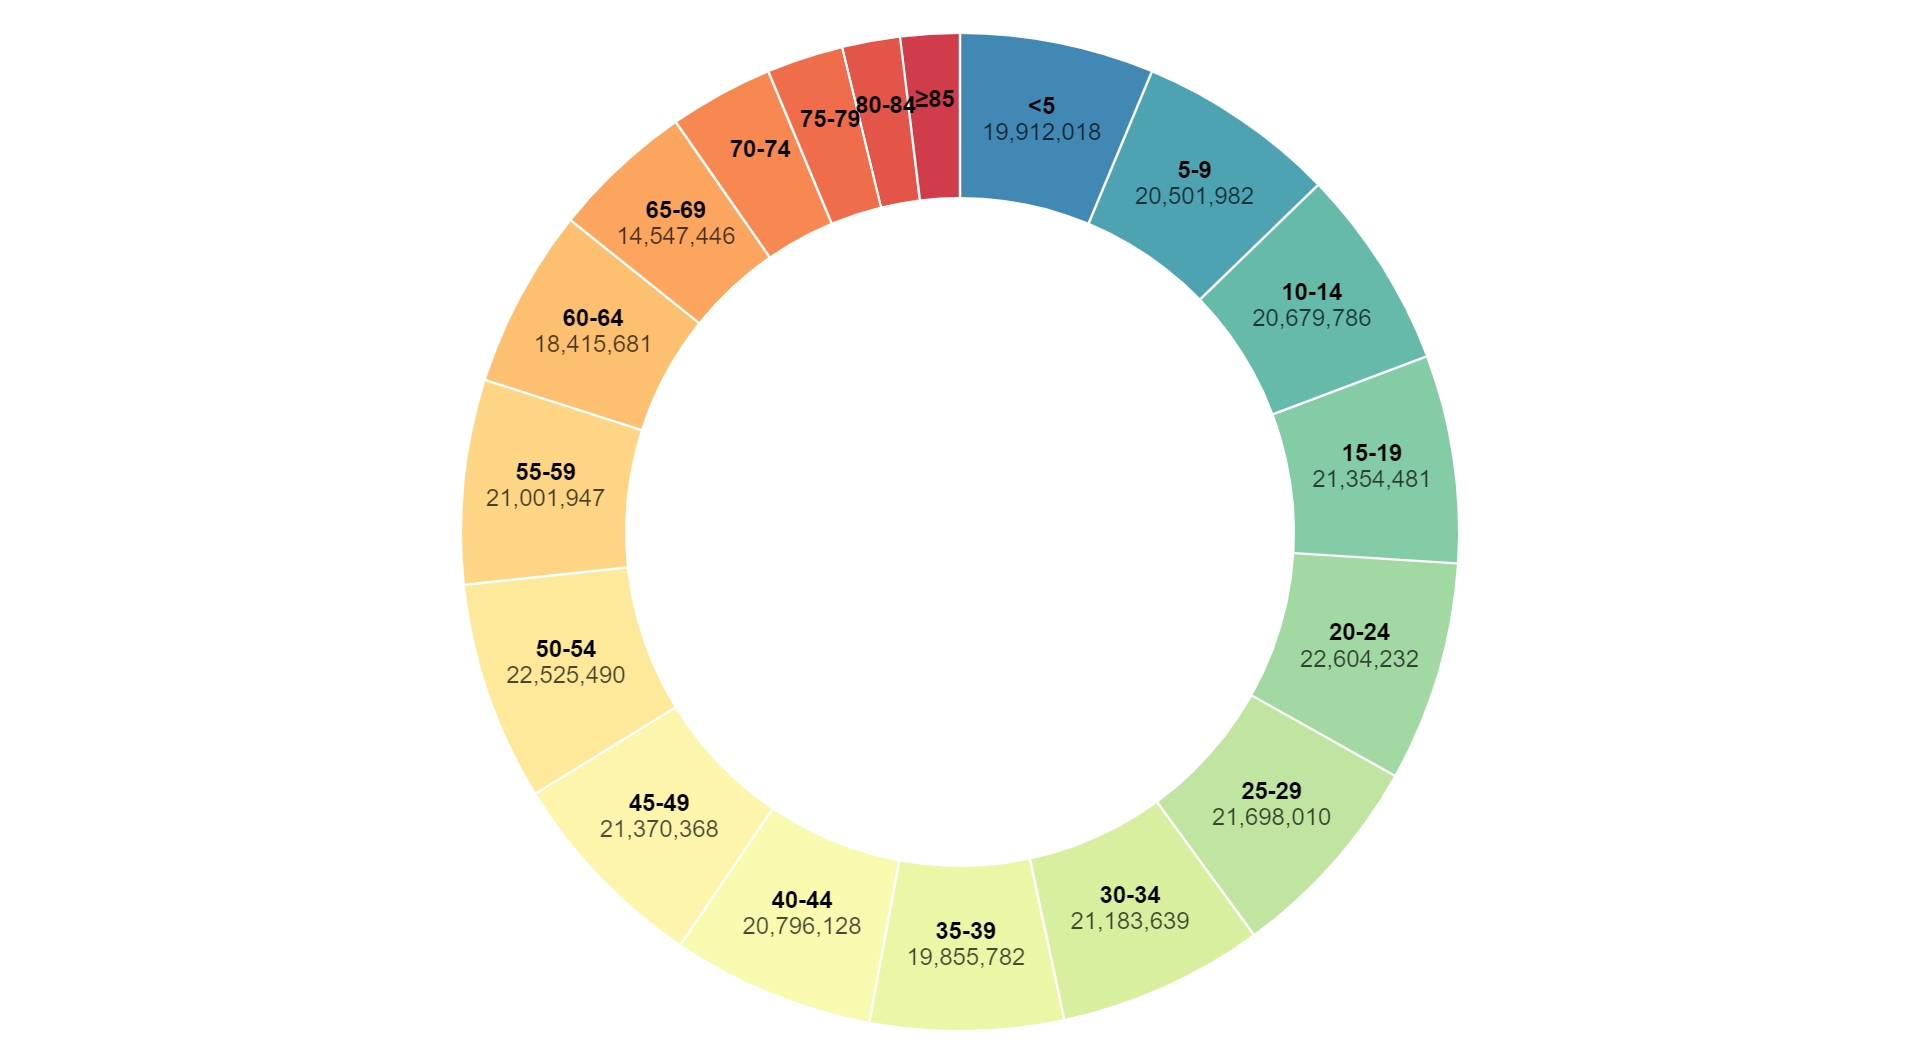
The uses of a donut chart include:
- Visualizing Budget Allocation: Donut charts can be used to visualize how a budget is allocated across different expense categories. Each slice of the chart represents a category of expenses (e.g., housing, transportation, food), allowing viewers to quickly understand how funds are distributed.
- Displaying Market Share: Donut charts are commonly used to display market share data, where each slice represents the share of a company or product in the market. This allows stakeholders to see the relative dominance of different players in a particular industry.
- Analyzing Sales Performance: In sales and marketing, donut charts can be used to analyze sales performance across different products, regions, or sales channels. Each slice represents a product or region, making it easy to identify top performers and areas for improvement.
- Presenting Survey Results: Donut charts are useful for presenting the results of surveys or polls, where each slice represents the percentage of respondents selecting a particular option. This provides a visual summary of survey responses and allows viewers to see the distribution of opinions.
- Monitoring Project Progress: Donut charts can be used to monitor the progress of projects by visualizing the completion status of different tasks or milestones. Each slice represents a task or milestone, making it easy to track progress and identify areas that may require attention.
- Comparing Revenue Sources: In financial analysis, donut charts can be used to compare revenue sources within a business (e.g., product lines, sales channels). Each slice represents a revenue source, allowing stakeholders to see which sources contribute the most to overall revenue.
Overall, the uses of a donut chart span various domains and applications, including budget allocation, market analysis, sales performance analysis, survey presentation, project monitoring, and financial analysis. It provides a visually intuitive way to represent proportions and compare categories, making it a valuable tool for data visualization and communication.

Reviews
There are no reviews yet.