Description
Description :
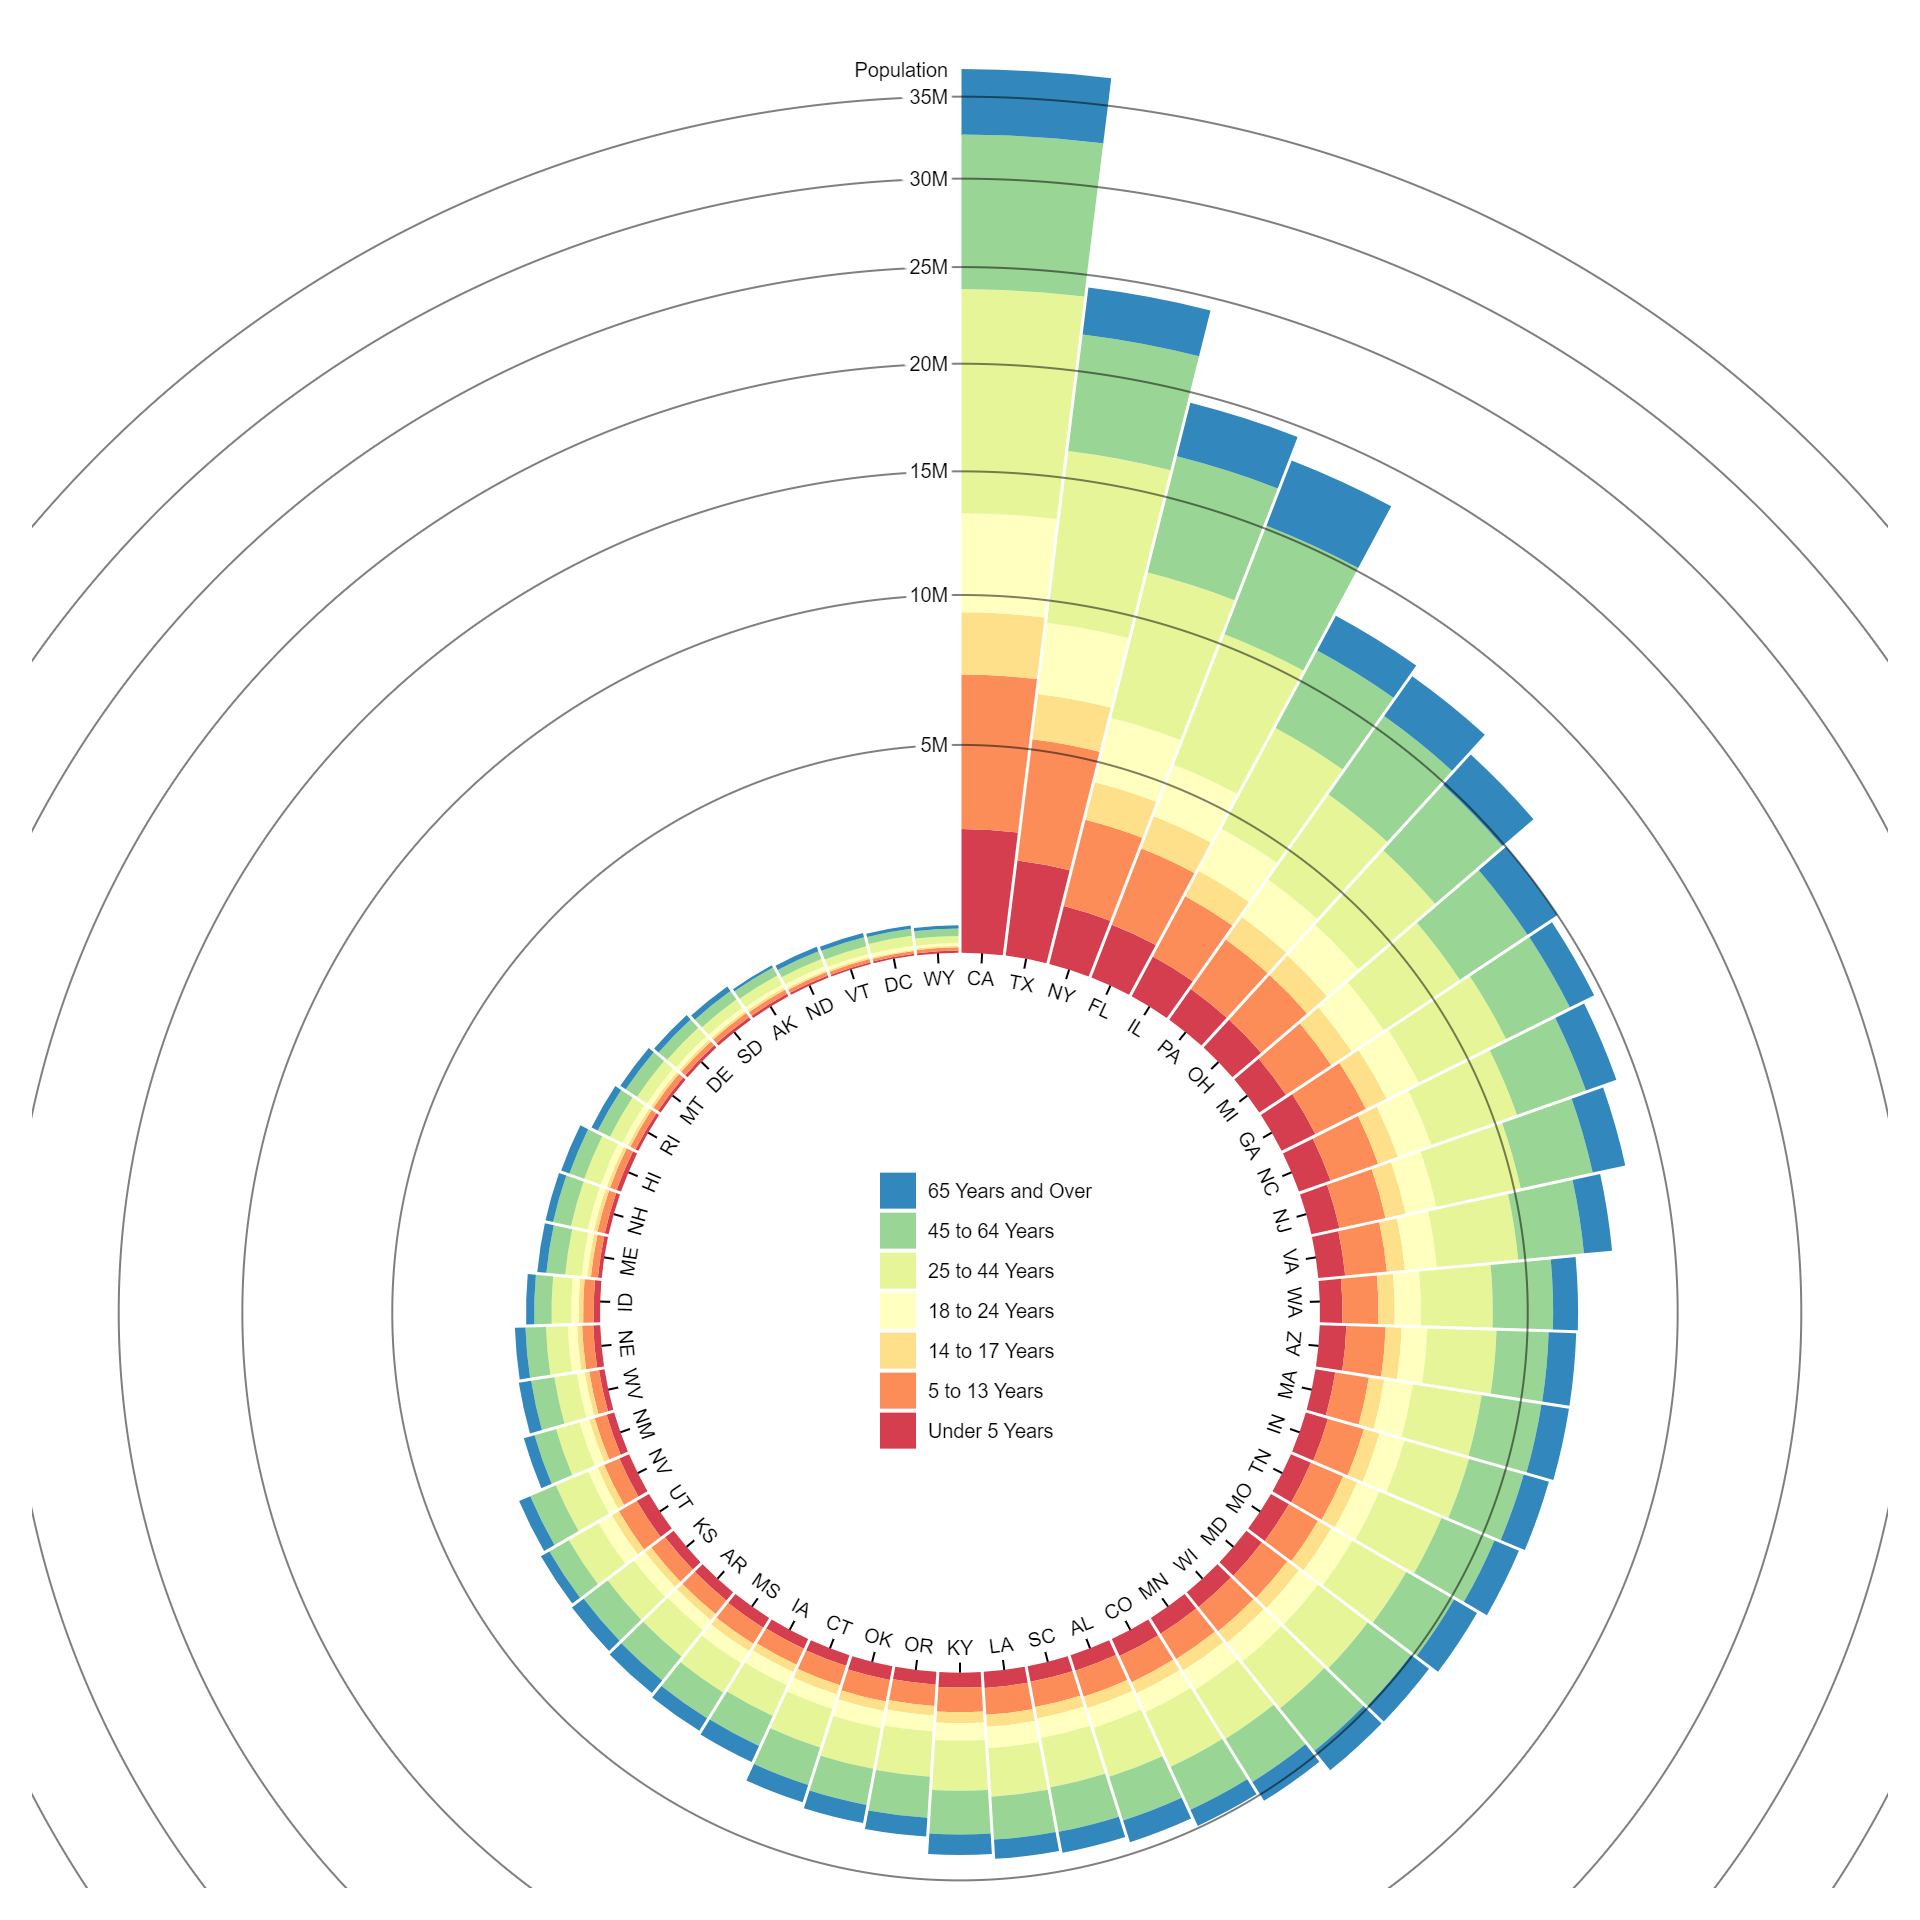
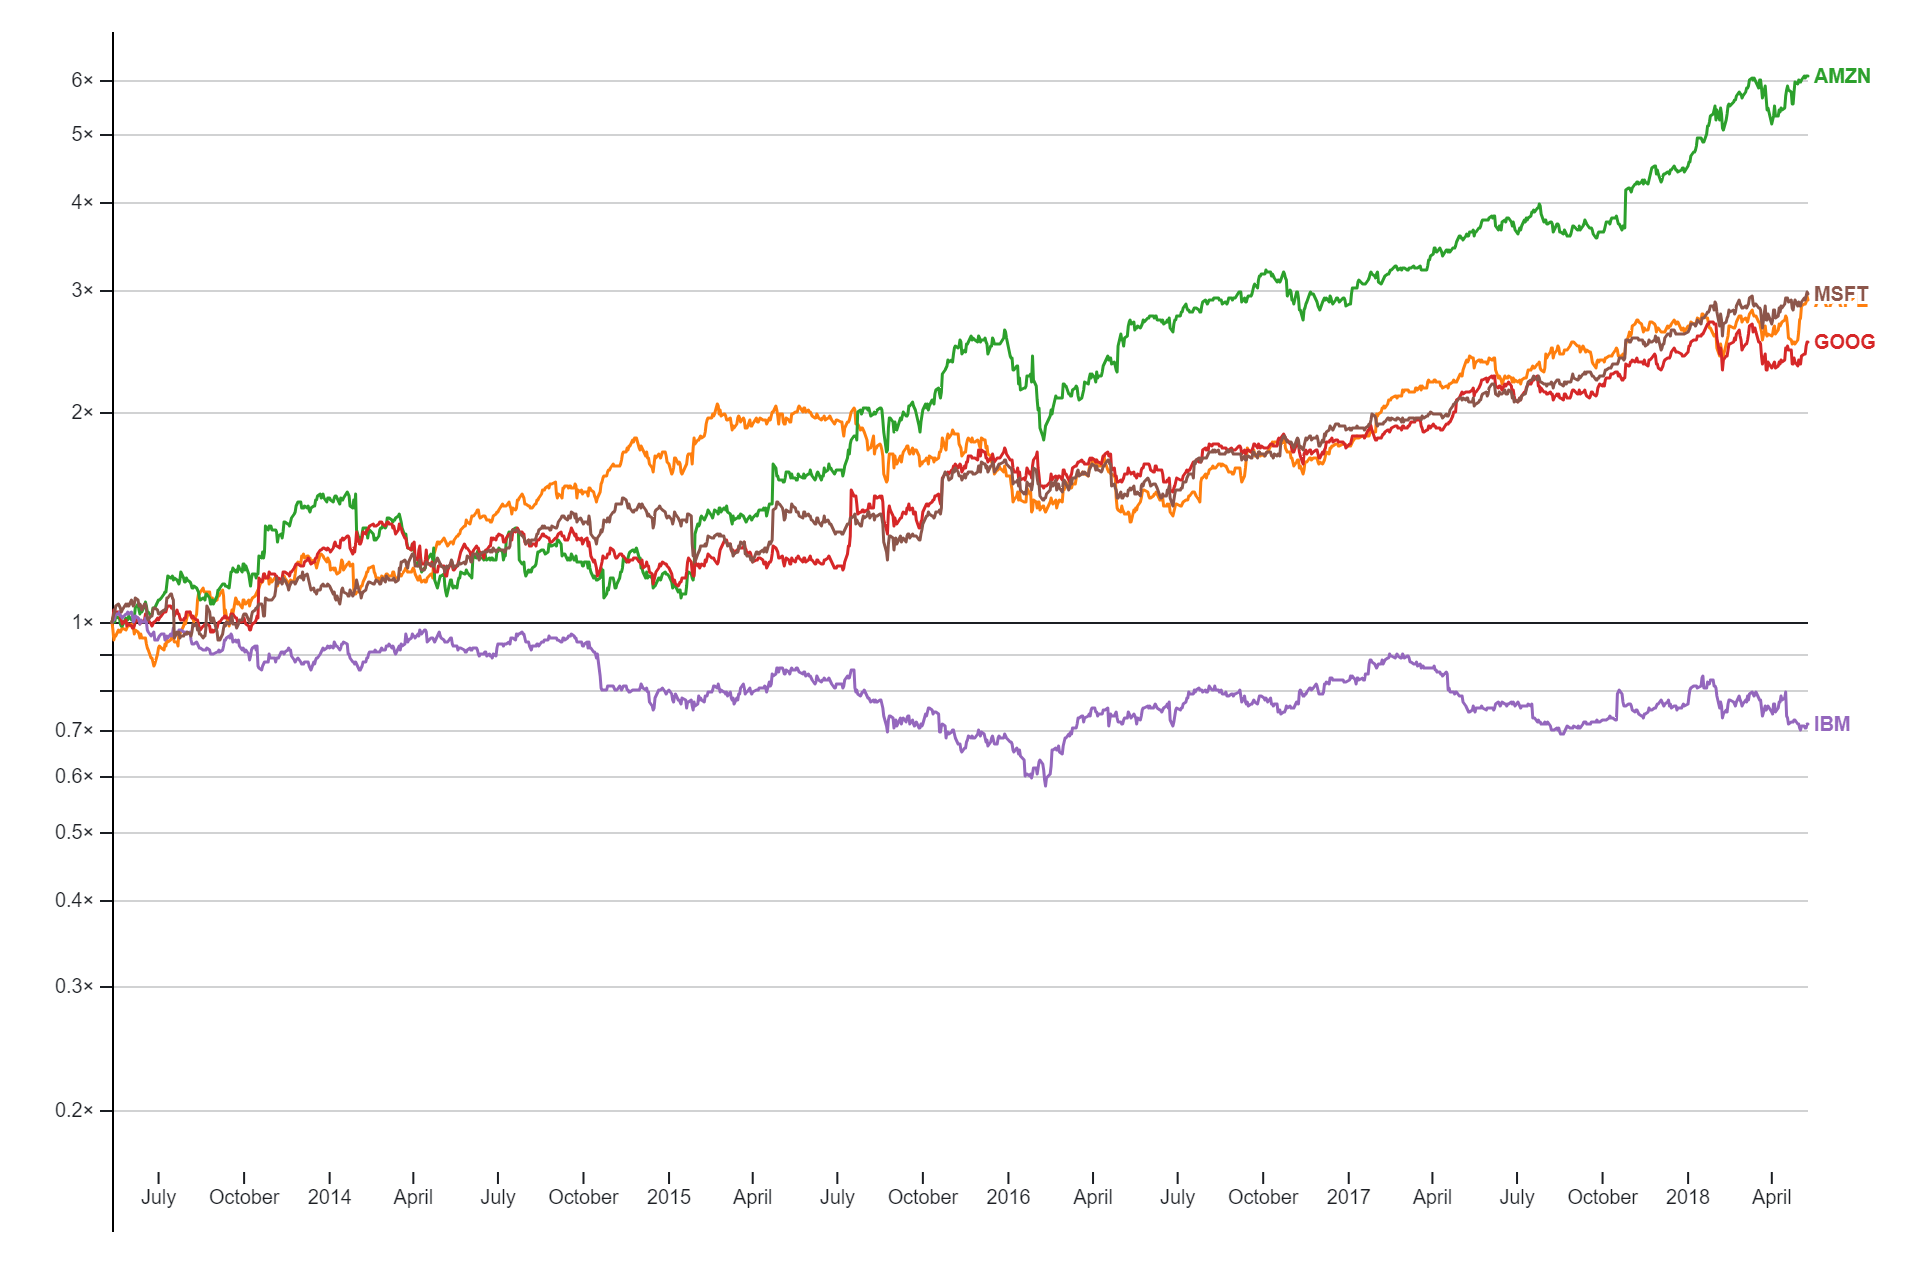
A versor dragging chart is an interactive data visualization tool used to explore complex datasets by dragging and rotating a multidimensional representation of the data. It allows users to manipulate the chart’s orientation to view data from different perspectives, aiding in pattern recognition and exploration of relationships between variables. This type of chart is particularly useful for visualizing high-dimensional datasets and uncovering insights that may not be apparent in traditional two-dimensional visualizations.
The purposes of versor dragging include:
- Exploratory Data Analysis (EDA): Versor dragging allows users to explore high-dimensional datasets by manipulating the orientation of the data visualization. This aids in uncovering patterns, trends, and relationships between variables.
- Dimensionality Reduction: Versor dragging can assist in dimensionality reduction by allowing users to focus on specific dimensions or combinations of dimensions within the dataset. This helps in simplifying complex datasets and identifying important features.
- Feature Selection: By interactively adjusting the orientation of the data visualization, versor dragging can help users select relevant features or variables for further analysis. This aids in feature selection and model building in machine learning tasks.
- Pattern Recognition: Versor dragging facilitates pattern recognition by enabling users to view the data from different perspectives. This allows for the identification of hidden patterns or clusters within the dataset.
- Interactive Visualization: Versor dragging provides an interactive visualization experience, allowing users to dynamically explore and interact with the data. This enhances the understanding of complex datasets and fosters insights discovery.
- Data Mining and Exploration: Versor dragging can be used for data mining and exploration tasks, such as anomaly detection, trend analysis, and hypothesis generation. By manipulating the orientation of the data visualization, users can uncover valuable insights and patterns within the data.
Overall, the purposes of versor dragging encompass exploratory data analysis, dimensionality reduction, feature selection, pattern recognition, interactive visualization, and data mining in various domains such as data science, machine learning, and scientific research.
The uses of versor dragging include:
- Exploratory Data Analysis (EDA): Versor dragging allows users to explore high-dimensional datasets by interactively adjusting the orientation of the data visualization. This helps in uncovering patterns, trends, and relationships between variables.
- Dimensionality Reduction: Versor dragging can aid in dimensionality reduction by enabling users to focus on specific dimensions or combinations of dimensions within the dataset. This simplifies complex datasets and facilitates analysis.
- Feature Selection: Users can employ versor dragging to select relevant features or variables for further analysis, particularly in machine learning tasks. By manipulating the orientation of the data visualization, users can identify important features.
- Pattern Recognition: Versor dragging facilitates pattern recognition by allowing users to view the data from different perspectives. This aids in identifying hidden patterns or clusters within the dataset.
- Interactive Visualization: Versor dragging provides an interactive visualization experience, allowing users to dynamically explore and interact with the data. This enhances understanding and fosters insights discovery.
- Data Mining and Exploration: Versor dragging can be used for data mining and exploration tasks, including anomaly detection, trend analysis, and hypothesis generation. Users can manipulate the orientation of the data visualization to uncover valuable insights and patterns.
- Scientific Research: Versor dragging is utilized in scientific research for exploring complex datasets and visualizing multidimensional data. It helps researchers gain insights into phenomena and relationships between variables in their studies.
- Education and Training: Versor dragging can be used as an educational tool for teaching concepts related to data visualization, exploratory data analysis, and dimensionality reduction. It provides students with hands-on experience in manipulating and interpreting multidimensional data.
Overall, the uses of versor dragging span across various domains, including data science, machine learning, scientific research, education, and beyond, where interactive exploration and analysis of high-dimensional datasets are required.
Only logged in customers who have purchased this product may leave a review.
Related products
-
- Sale!
Nested Tree Map
-
$ 15Original price was: $ 15.$ 10Current price is: $ 10. - Add to cart
-
- Sale!
Tree Map
-
$ 15Original price was: $ 15.$ 10Current price is: $ 10. - Add to cart
-
- Sale!
Q-Q Plot
-
$ 15Original price was: $ 15.$ 10Current price is: $ 10. - Add to cart


Reviews
There are no reviews yet.