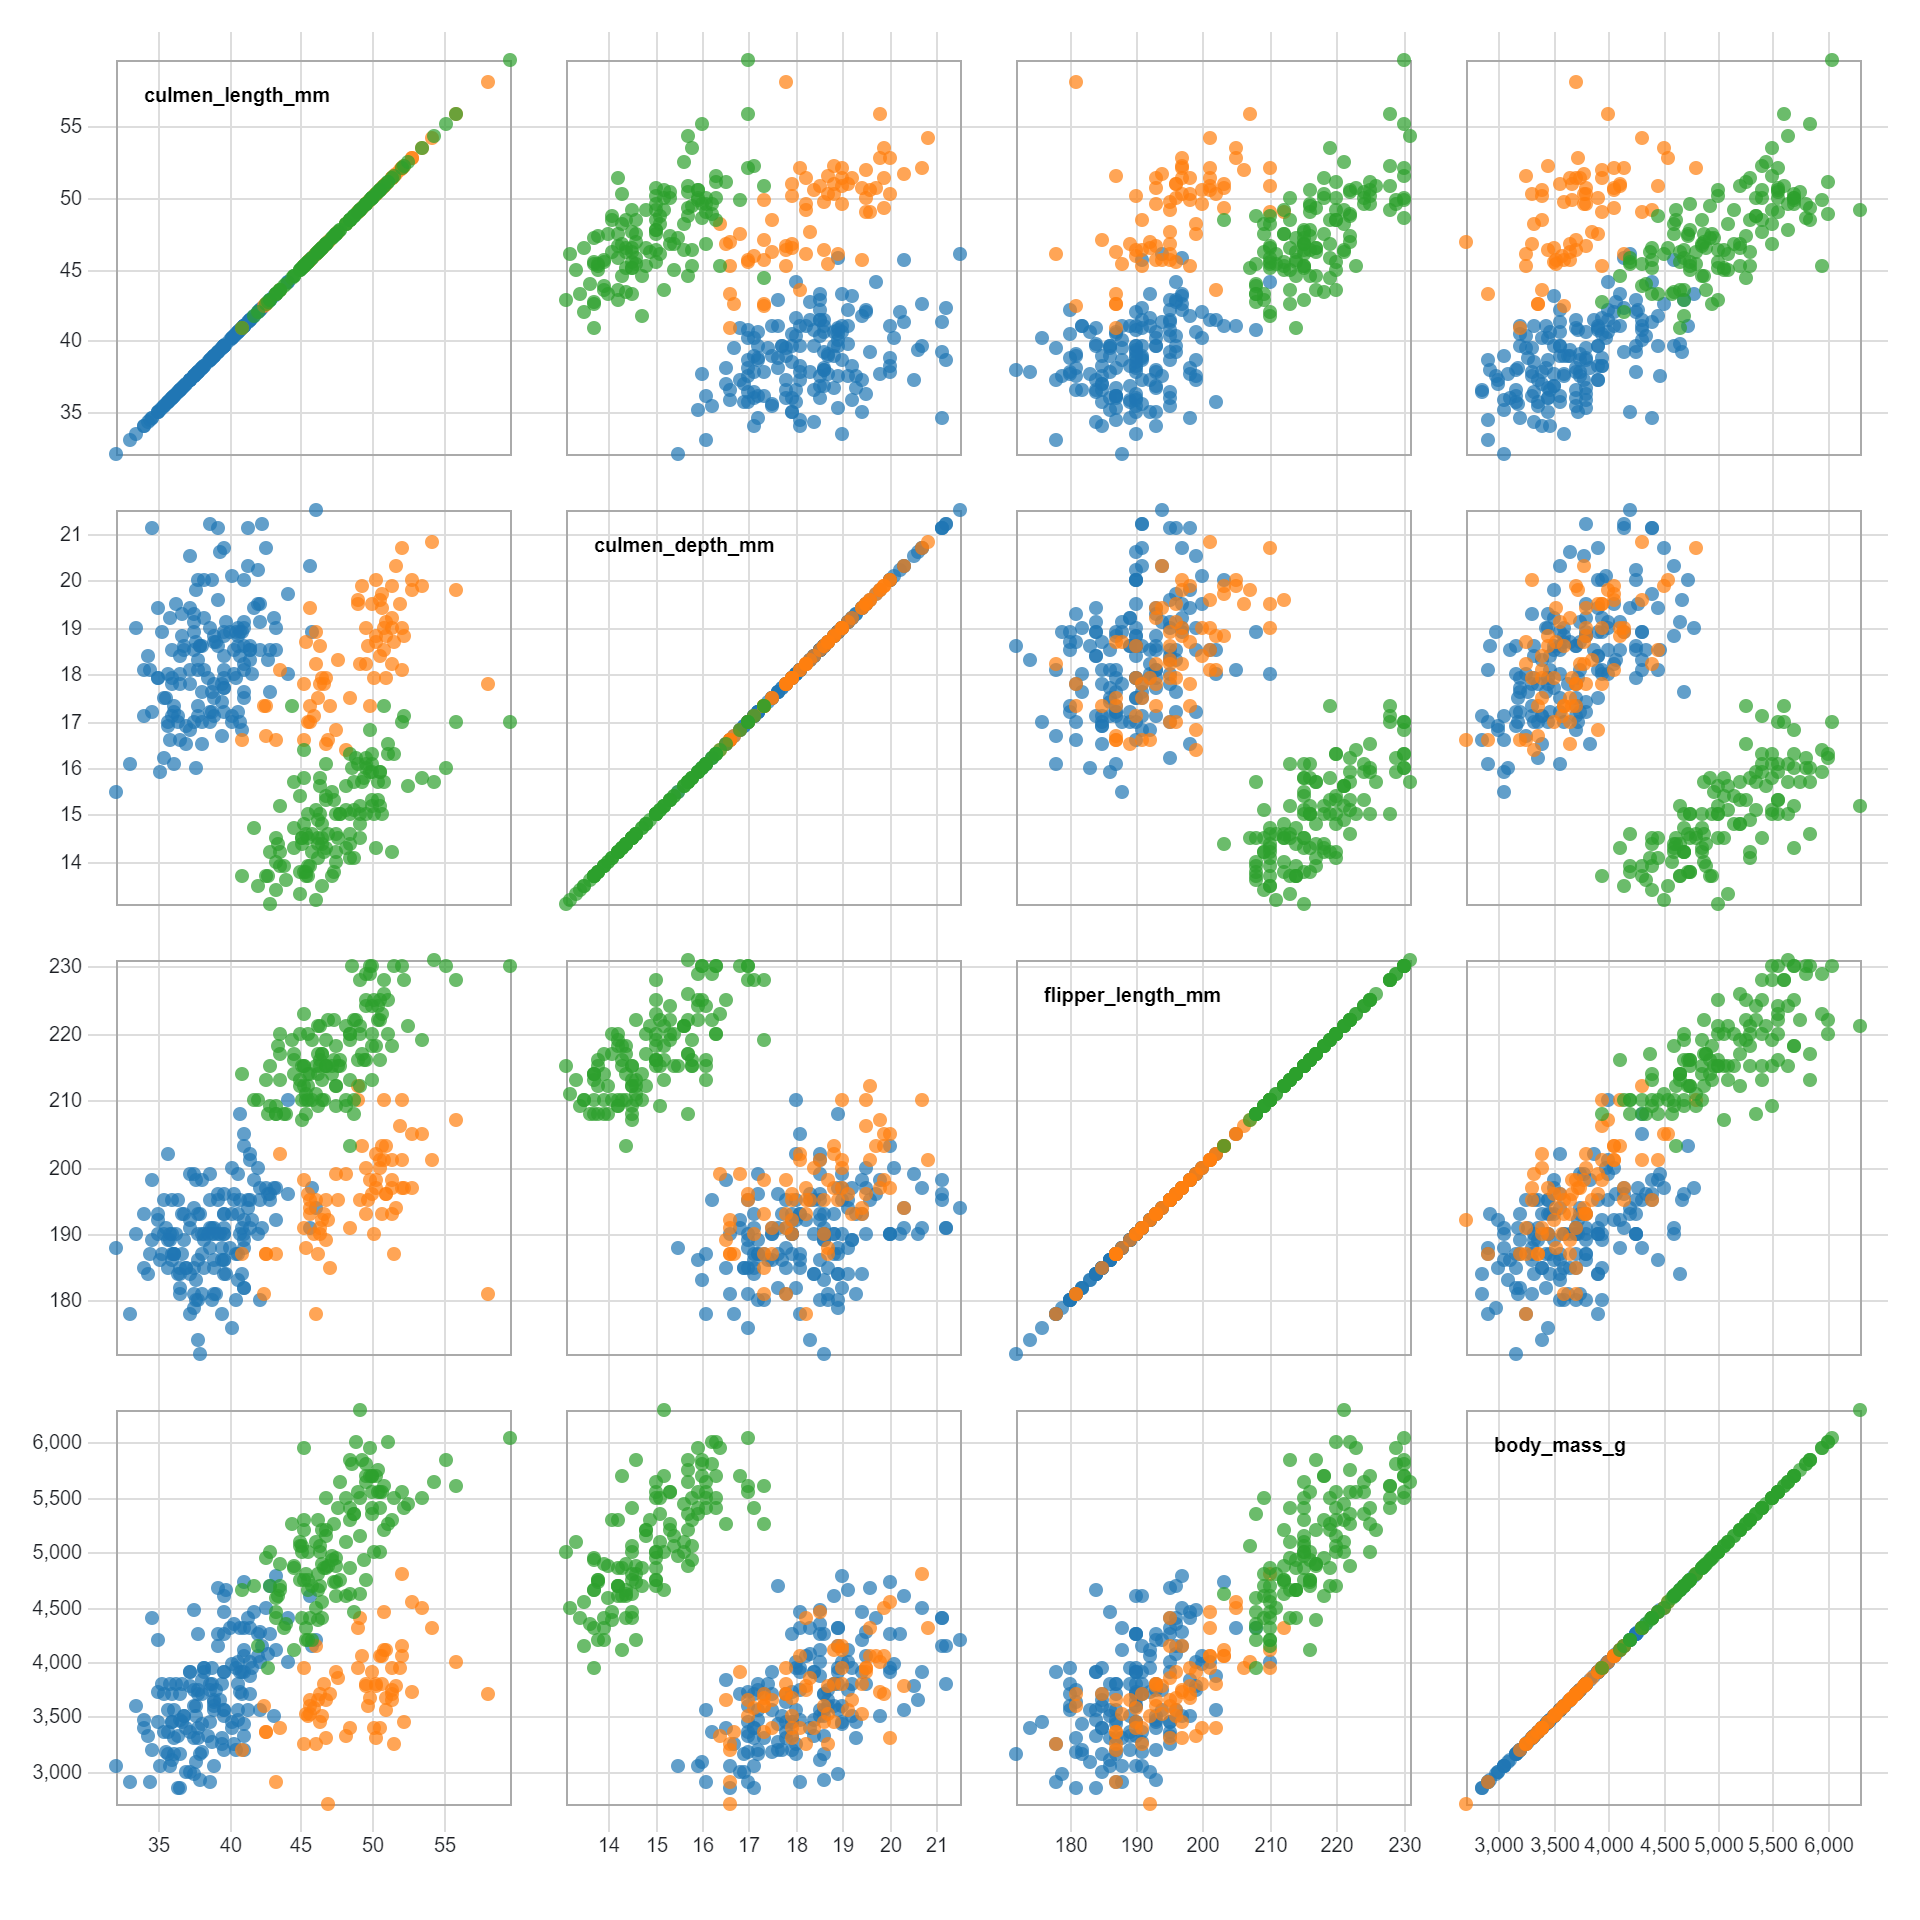
Brushable scatterplot matrix
$ 15 Original price was: $ 15.$ 10Current price is: $ 10.
Description
Description :
A brushable scatterplot matrix is an interactive data visualization that displays multiple scatterplots arranged in a grid. Users can select and highlight data points in one scatterplot, and corresponding points in all other plots are automatically highlighted. This allows for simultaneous exploration of relationships between variables across multiple dimensions, aiding in data analysis and pattern recognition.
The purposes of a brushable scatterplot matrix chart include:
- Exploratory Data Analysis: Brushable scatterplot matrices facilitate exploratory data analysis by allowing users to visually inspect relationships between variables in multivariate datasets. Users can identify patterns, trends, and correlations across multiple dimensions.
- Feature Selection: In machine learning and statistical modeling, brushable scatterplot matrices can aid in feature selection by visually identifying variables that exhibit strong relationships with the target variable. This helps in selecting the most relevant features for predictive modeling.
- Outlier Detection: Users can use brushable scatterplot matrices to detect outliers by identifying data points that deviate significantly from the general pattern observed in the scatterplots. Outliers may indicate data quality issues or unusual observations that warrant further investigation.
- Pattern Recognition: Brushable scatterplot matrices help users recognize patterns and clusters within the data by visually exploring relationships between variables. This can be particularly useful in identifying distinct groups or clusters in the dataset.
- Correlation Analysis: Brushable scatterplot matrices allow users to assess correlations between pairs of variables by observing the direction and strength of the relationships displayed in the scatterplots. This aids in understanding the interdependencies between variables.
- Data Filtering and Subsetting: Users can interactively select and highlight data points of interest in one scatterplot, and corresponding points in other plots are automatically highlighted. This enables users to filter and subset the data based on specific criteria or patterns identified in the visualization.
Overall, the brushable scatterplot matrix chart serves as a powerful tool for exploratory data analysis, feature selection, outlier detection, pattern recognition, correlation analysis, and data filtering and subsetting in various domains such as data science, statistics, and machine learning.
Suitable uses of a brushable scatterplot matrix include:
- Data Exploration: Brushable scatterplot matrices are ideal for exploring relationships between multiple variables in a dataset, enabling users to visually inspect patterns, trends, and correlations.
- Feature Selection: In machine learning tasks, brushable scatterplot matrices help in identifying relevant features by assessing their relationships with the target variable. This aids in selecting the most predictive variables for model building.
- Outlier Detection: Users can use brushable scatterplot matrices to detect outliers by identifying data points that significantly deviate from the general trend observed in the scatterplots.
- Pattern Recognition: Brushable scatterplot matrices assist users in recognizing clusters or patterns within the data by visually exploring relationships between variables.
- Correlation Analysis: Users can assess the strength and direction of correlations between pairs of variables by examining the patterns displayed in the scatterplots.
- Data Filtering and Subsetting: Brushable scatterplot matrices allow users to interactively select and highlight data points of interest, enabling data filtering and subsetting based on specific criteria or patterns identified during exploration.
- Model Validation: In predictive modeling, brushable scatterplot matrices can be used to validate model assumptions and assess the suitability of input variables for model building by examining their relationships with the target variable.
- Interactive Reporting: Brushable scatterplot matrices provide an interactive visualization tool for communicating insights and findings to stakeholders, facilitating dynamic exploration of the data during presentations or discussions.
Overall, brushable scatterplot matrices serve as powerful tools for exploratory data analysis, feature selection, outlier detection, pattern recognition, correlation analysis, data filtering and subsetting, model validation, and interactive reporting in various fields such as data science, statistics, and machine learning.
Only logged in customers who have purchased this product may leave a review.
Related products
-
- Sale!
Cascaded Tree Map
-
$ 15Original price was: $ 15.$ 10Current price is: $ 10. - Add to cart
-
- Sale!
Volcano Contours
-
$ 15Original price was: $ 15.$ 10Current price is: $ 10. - Add to cart
-
- Sale!
Radial Tidy Tree
-
$ 15Original price was: $ 15.$ 10Current price is: $ 10. - Add to cart


Reviews
There are no reviews yet.