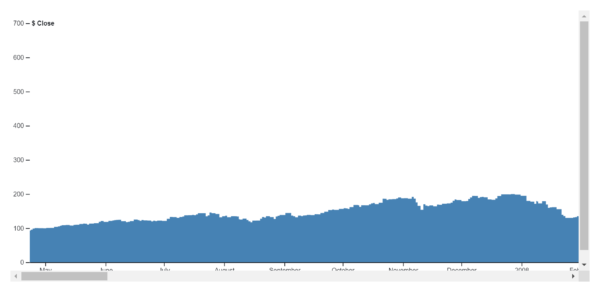
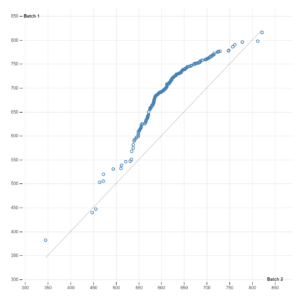
A pannable chart is a type of chart that allows the user to scroll horizontally or vertically to see different parts of the data. It is useful for displaying large or high-resolution datasets that do not fit in a single view.
Purpose:
The purposes of a pannable chart include:
Flexible Data Exploration: Pannable charts enable users to explore large datasets by panning across different sections of the chart. This flexibility allows users to focus on specific regions or data points of interest, enhancing their understanding of the data.
Interactive Analysis: Users can interactively analyze data by panning the chart to examine trends, patterns, and relationships within the dataset. The ability to navigate through the data dynamically facilitates deeper insights and more informed decision-making.
Contextual Understanding: Pannable charts provide users with a contextual understanding of the data by allowing them to navigate between different levels of detail. Users can zoom out to see the big picture and zoom in to explore specific details, gaining a comprehensive view of the dataset.
User-Friendly Visualization: Pannable charts offer a user-friendly visualization interface that allows users to interact with the data intuitively. The ability to pan the chart using familiar gestures, such as clicking and dragging, makes the visualization accessible to a wide range of users.
Presentation and Communication: Pannable charts are useful for presenting and communicating data to stakeholders, clients, or colleagues. The interactive nature of the charts allows presenters to engage the audience and convey key insights effectively, enhancing the communication of data-driven messages.
Overall, the purposes of a pannable chart include facilitating flexible data exploration, interactive analysis, contextual understanding, user-friendly visualization, and presentation and communication of insights.
Uses :
The uses of a pannable chart include:
Data Exploration: Users can explore large datasets by panning across different sections of the chart, allowing them to focus on specific regions or data points of interest.
Interactive Analysis: Pannable charts facilitate interactive analysis by enabling users to navigate through the data dynamically, examining trends, patterns, and relationships within the dataset.
Contextual Understanding: Users can gain a contextual understanding of the data by panning the chart to explore different levels of detail. This allows them to zoom out to see the big picture and zoom in to examine specific details.
User-Friendly Visualization: Pannable charts offer a user-friendly visualization interface that allows users to interact with the data intuitively, enhancing the accessibility of the visualization to a wide range of users.
Presentation and Communication: Pannable charts are useful for presenting and communicating data to stakeholders, clients, or colleagues. The interactive nature of the charts allows presenters to engage the audience and convey key insights effectively, enhancing the communication of data-driven messages.
Overall, pannable charts are versatile visualization tools that find applications in various domains and industries where flexible data exploration, interactive analysis, contextual understanding, user-friendly visualization, and effective presentation and communication of insights are required.
Reviews
There are no reviews yet.
Only logged in customers who have purchased this product may leave a review.

Reviews
There are no reviews yet.