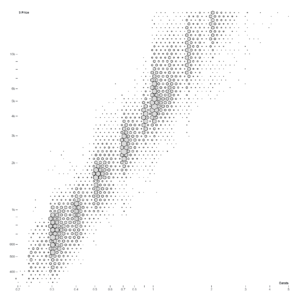
A zoomable chart is an interactive visualization tool that enables users to explore and analyze data by zooming in and out of specific regions or data points. This dynamic functionality allows users to delve into details while maintaining an overview of the entire dataset, enhancing the process of data exploration and analysis.
Purposes :
The purposes of zoomable charts include:
Data Exploration: Zoomable charts allow users to explore large datasets by zooming in and out of specific regions or data points. This facilitates a detailed examination of data while maintaining an overall perspective.
Interactive Analysis: Users can interact with zoomable charts to perform interactive analysis, such as identifying trends, outliers, or patterns within the data. The ability to zoom provides a closer examination of individual data points or groups.
Detail-Oriented Visualization: Zoomable charts cater to users who require a high level of detail in their data visualization. By allowing users to zoom into specific areas of interest, these charts provide a granular view of the data that may not be visible in a standard chart.
Comparison and Context: Zoomable charts facilitate comparisons between different data points or categories by allowing users to zoom in on specific sections of the chart. This helps users understand the relative sizes and proportions of data elements within the dataset.
User-Friendly Interaction: Zoomable charts offer an intuitive and user-friendly interface for interacting with complex datasets. Users can easily navigate through the data using familiar zooming gestures, making it accessible to a wide range of users.
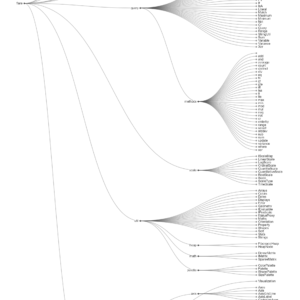
Presentation of Hierarchical Data: For datasets with hierarchical structures, such as nested categories or subgroups, zoomable charts provide an effective way to visualize the data at different levels of granularity. Users can zoom in to explore lower-level categories while maintaining an understanding of the overall hierarchy.
Overall, zoomable charts serve multiple purposes, including efficient data exploration, interactive analysis, detail-oriented visualization, comparison and context, user-friendly interaction, and presentation of hierarchical data. They are valuable tools for gaining insights and making data-driven decisions across various industries and applications.
Uses :
Zoomable charts are utilized in various domains and applications for:
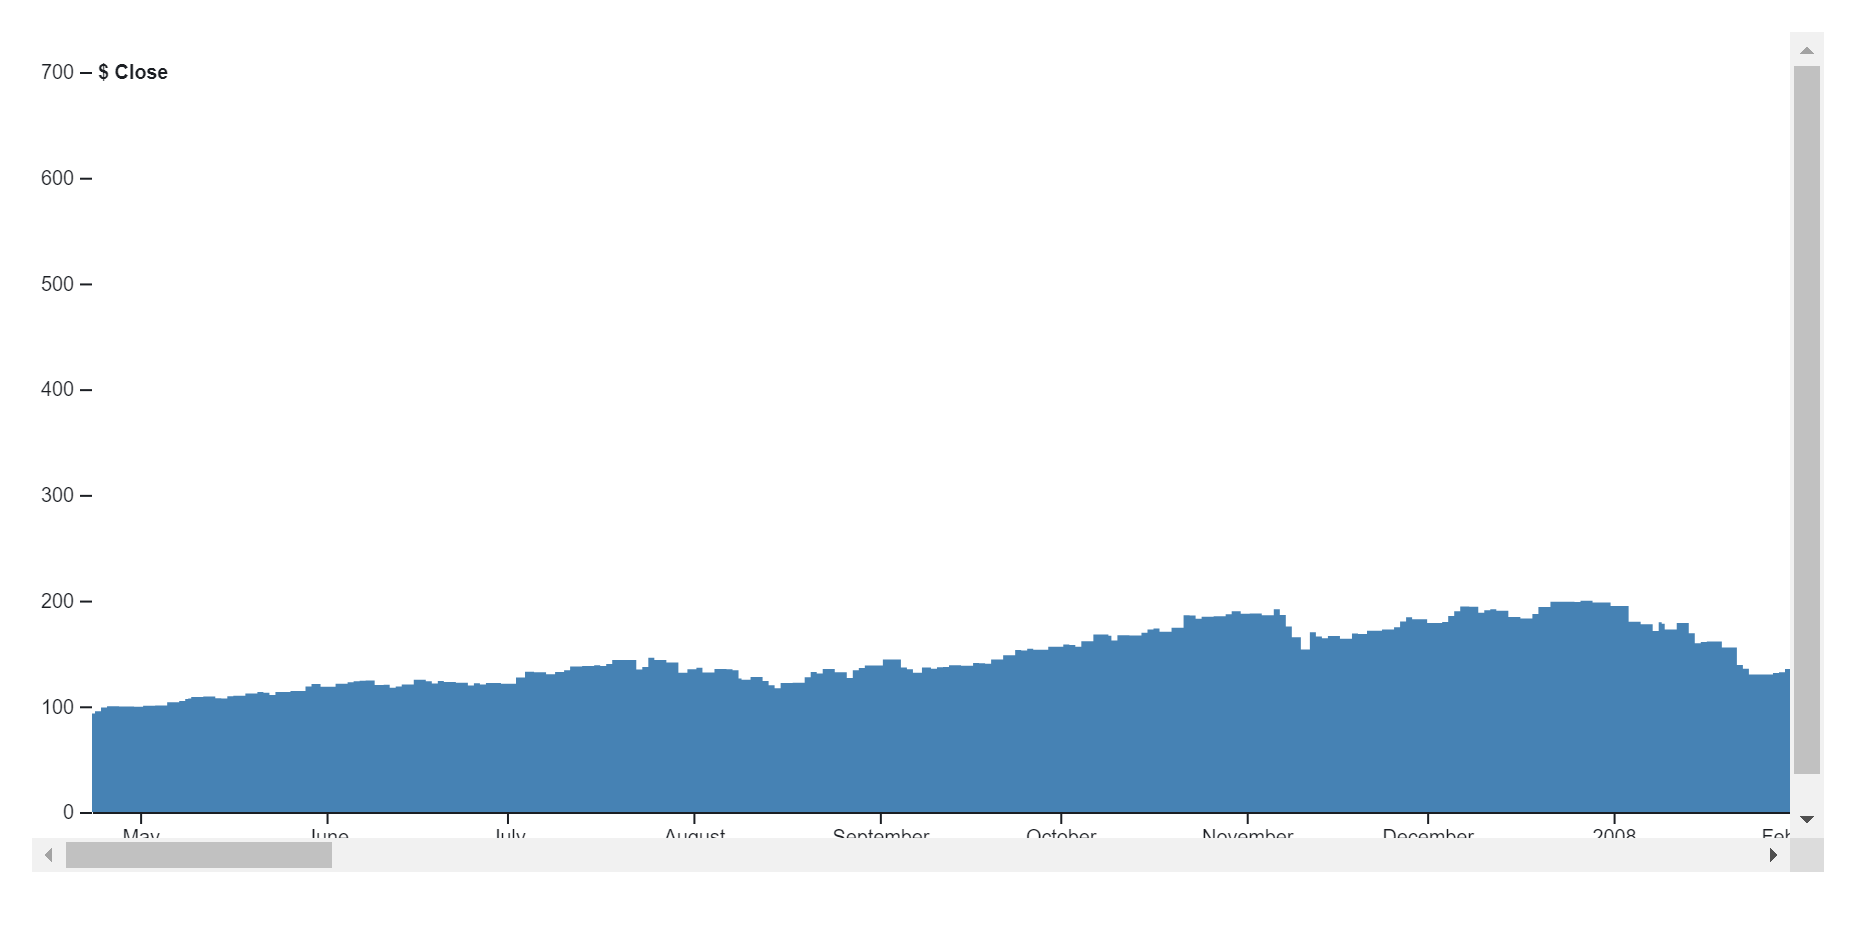
Financial Analysis: Analyzing stock market trends, portfolio performance, and financial metrics by zooming into specific time periods or market segments.
Sales and Marketing: Visualizing sales data, market trends, and customer demographics to identify opportunities and target audiences more effectively.
Scientific Research: Exploring complex datasets in fields such as biology, physics, and environmental science to uncover patterns, relationships, and insights.
Business Intelligence: Analyzing business metrics, KPIs, and operational data to make data-driven decisions and improve business performance.
Geospatial Analysis: Zooming into maps and geographical data to analyze spatial patterns, demographic trends, and urban development.
Healthcare Analytics: Studying patient outcomes, medical procedures, and healthcare performance metrics to improve patient care and treatment outcomes.
Supply Chain Management: Optimizing inventory levels, logistics routes, and supply chain efficiency by analyzing supply chain data at different levels of granularity.
Educational Purposes: Teaching data analysis concepts and techniques in classrooms, workshops, and online courses using interactive zoomable charts.
Data Journalism: Visualizing and presenting data-driven stories, investigative reports, and journalistic findings in a dynamic and interactive format.
Government and Public Policy: Analyzing demographic data, socioeconomic indicators, and public policy outcomes to inform decision-making and policy formulation.
Environmental Monitoring: Monitoring environmental data, climate patterns, and ecological indicators to assess environmental trends and inform conservation efforts.
Customer Analytics: Analyzing customer behavior, purchase patterns, and engagement metrics to optimize marketing strategies and improve customer experiences.
Overall, zoomable charts are versatile tools that enable users to explore, analyze, and visualize complex datasets in a dynamic and interactive manner across various industries and applications.
Reviews
There are no reviews yet.
Only logged in customers who have purchased this product may leave a review.

Reviews
There are no reviews yet.