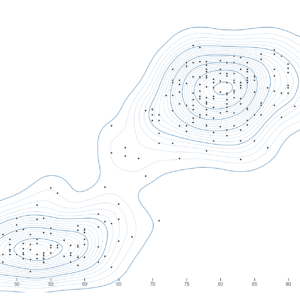
Gradient encoding in a line chart involves using color gradients along the lines to represent variations in data values. By transitioning smoothly between different colors along the line, this method visually communicates changes in the data’s magnitude or direction. It enhances visual perception, making it easier to identify patterns, trends, and outliers within the dataset. Gradient encoding adds depth and clarity to the visualization, facilitating intuitive interpretation of complex data relationships.
Purposes :
The purposes of using gradient encoding in a line chart include:
Enhanced Data Representation: Gradient encoding adds depth and richness to the visualization, making it more visually appealing and engaging to the audience.
Highlighting Trends and Patterns: By using color gradients along the lines, gradient encoding can effectively highlight trends, patterns, and variations in the data, making it easier for viewers to identify important insights.
Visualizing Magnitude or Directional Changes: Color gradients provide a visual representation of changes in magnitude or direction within the data, allowing viewers to quickly discern increases, decreases, or shifts in trends.
Differentiating Multiple Lines: In multi-series line charts, gradient encoding can help distinguish between different lines or categories by assigning unique color gradients to each series, improving clarity and readability.
Adding Contextual Information: By associating specific colors with certain data values or ranges, gradient encoding can provide additional contextual information, such as highlighting thresholds or indicating data segments of interest.
Facilitating Interpretation: Gradient encoding aids in the intuitive interpretation of complex datasets by leveraging the human visual system’s ability to perceive color variations, allowing viewers to extract insights more effectively.
Enhancing Aesthetics: Gradient encoding adds aesthetic appeal to the visualization, making it more visually appealing and engaging, which can enhance the audience’s overall experience and retention of information.
Overall, gradient encoding in a line chart serves to improve data communication, facilitate interpretation, and enhance the overall visual appeal of the visualization.
Uses :
Gradient encoding in line charts serves various purposes across different contexts:
Highlighting Trends: It can be used to highlight trends or patterns in the data by encoding the line with a color gradient that reflects the direction or magnitude of change.
Differentiating Data Series: Gradient encoding helps differentiate multiple data series in a line chart, making it easier for viewers to distinguish between them and understand their individual trends.
Visualizing Magnitude: By using color gradients to represent data values, gradient encoding provides a visual representation of the magnitude of values along the line, aiding in data interpretation.
Enhancing Readability: Gradient encoding improves the readability of line charts by adding visual cues that guide viewers’ attention to important data points or trends, thereby facilitating quicker understanding of the information presented.
Improving Aesthetics: Gradient encoding enhances the aesthetics of line charts, making them more visually appealing and engaging for viewers, which can improve comprehension and retention of information.
Adding Context: Gradient encoding can provide additional context to the data by associating specific colors with certain data ranges or categories, helping viewers better understand the significance of different data points or trends.
Highlighting Anomalies: It can be used to highlight anomalies or outliers in the data by encoding them with distinct color gradients, making them stand out from the rest of the data points.
Interactive Data Exploration: In interactive line charts, gradient encoding allows users to dynamically adjust the color gradients based on user interactions, enabling them to explore the data at different levels of granularity or focus on specific aspects of interest.
Overall, gradient encoding in line charts enhances data visualization by improving readability, highlighting trends, and adding visual appeal, making it a valuable tool for conveying complex information effectively.
Reviews
There are no reviews yet.
Only logged in customers who have purchased this product may leave a review.

Reviews
There are no reviews yet.