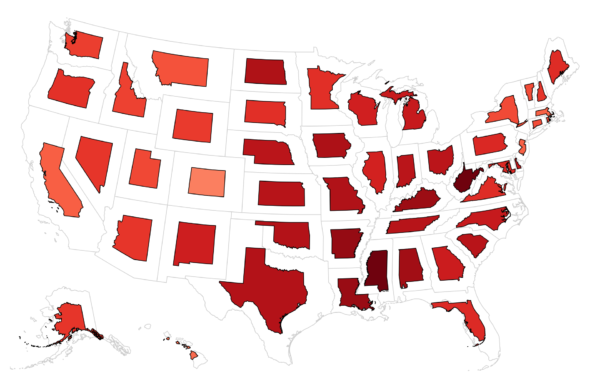
A non-contiguous cartogram is a type of thematic map that distorts geographical regions based on a specific variable of interest, such as population or economic activity, without maintaining the true spatial relationships between them. Unlike contiguous cartograms, which preserve the adjacency of regions, non-contiguous cartograms allow areas to be disconnected or fragmented, depending on the magnitude of the variable being represented. This technique is often used in data visualization to emphasize spatial patterns and disparities across regions, providing a visually intuitive way to understand complex data sets.
Purpose :
Non-contiguous cartograms are specialized map representations that distort the geographic space to emphasize specific data values rather than accurately depicting geographical boundaries. They serve several purposes in data visualization and analysis:
Data Representation: Non-contiguous cartograms provide a visually compelling way to represent spatial data by resizing and reshaping geographic regions based on a particular variable of interest. This allows viewers to quickly grasp patterns and trends in the data across different regions.
Emphasis on Data Distribution: By distorting the size and shape of regions according to the data being visualized, non-contiguous cartograms highlight the distribution and concentration of values. This can reveal spatial patterns that may not be apparent in traditional geographic maps.
Comparative Analysis: Non-contiguous cartograms enable easy comparison of data values across regions, as the size of each region corresponds directly to the value being represented. This makes it straightforward to identify areas of high and low values and to compare these values across different regions.
Focus on Specific Issues: Non-contiguous cartograms allow users to focus on specific issues or themes by emphasizing certain data values while de-emphasizing others. This can be particularly useful for highlighting disparities, inequalities, or concentrations of particular phenomena across geographic regions.
Simplification of Complex Data: Non-contiguous cartograms simplify complex datasets by representing them in a visually intuitive manner. This can help researchers, policymakers, and the general public better understand and interpret complex spatial data without requiring specialized knowledge or technical skills.
Communication and Engagement: Non-contiguous cartograms are effective tools for communicating key messages and insights derived from spatial data to a broad audience. Their visually striking nature can engage viewers and stimulate interest in the underlying issues or topics being presented.
Decision-Making Support: Non-contiguous cartograms can inform decision-making processes by providing stakeholders with clear visualizations of spatial data relevant to their needs. Decision-makers can use these visualizations to identify areas requiring intervention, allocate resources effectively, and develop targeted policies or strategies.
Uses :
Non-contiguous cartograms, which distort the geographic space to emphasize specific data values rather than accurately depict geographical boundaries, serve various practical purposes in data visualization and analysis. Here are some common uses:
Data Representation: Non-contiguous cartograms provide a visually compelling way to represent spatial data by resizing and reshaping geographic regions based on a particular variable of interest. This enables viewers to quickly grasp patterns and trends in the data across different regions.
Comparative Analysis: By distorting the size and shape of regions according to the data being visualized, non-contiguous cartograms facilitate easy comparison of data values across regions. This makes it straightforward to identify areas of high and low values and to compare these values across different regions.
Highlighting Spatial Patterns: Non-contiguous cartograms are effective for highlighting spatial patterns, disparities, and inequalities across geographic regions. They can reveal spatial relationships and distributions that may not be apparent in traditional geographic maps, drawing attention to areas requiring intervention or further study.
Simplifying Complex Data: Non-contiguous cartograms simplify complex datasets by representing them in a visually intuitive manner. This helps researchers, policymakers, and the general public better understand and interpret complex spatial data without requiring specialized knowledge or technical skills.
Supporting Decision-Making: Non-contiguous cartograms can inform decision-making processes by providing stakeholders with clear visualizations of spatial data relevant to their needs. Decision-makers can use these visualizations to identify areas requiring intervention, allocate resources effectively, and develop targeted policies or strategies.
Communicating Insights: Non-contiguous cartograms are effective tools for communicating key insights derived from spatial data to a broad audience. Their visually striking nature can engage viewers and stimulate interest in the underlying issues or topics being presented.
Educational Purposes: Non-contiguous cartograms can be used in educational settings to teach students about spatial data analysis, inequalities, and geographic patterns. They provide hands-on experience with data visualization techniques and help students develop critical thinking skills.
Reviews
There are no reviews yet.
Only logged in customers who have purchased this product may leave a review.


Reviews
There are no reviews yet.