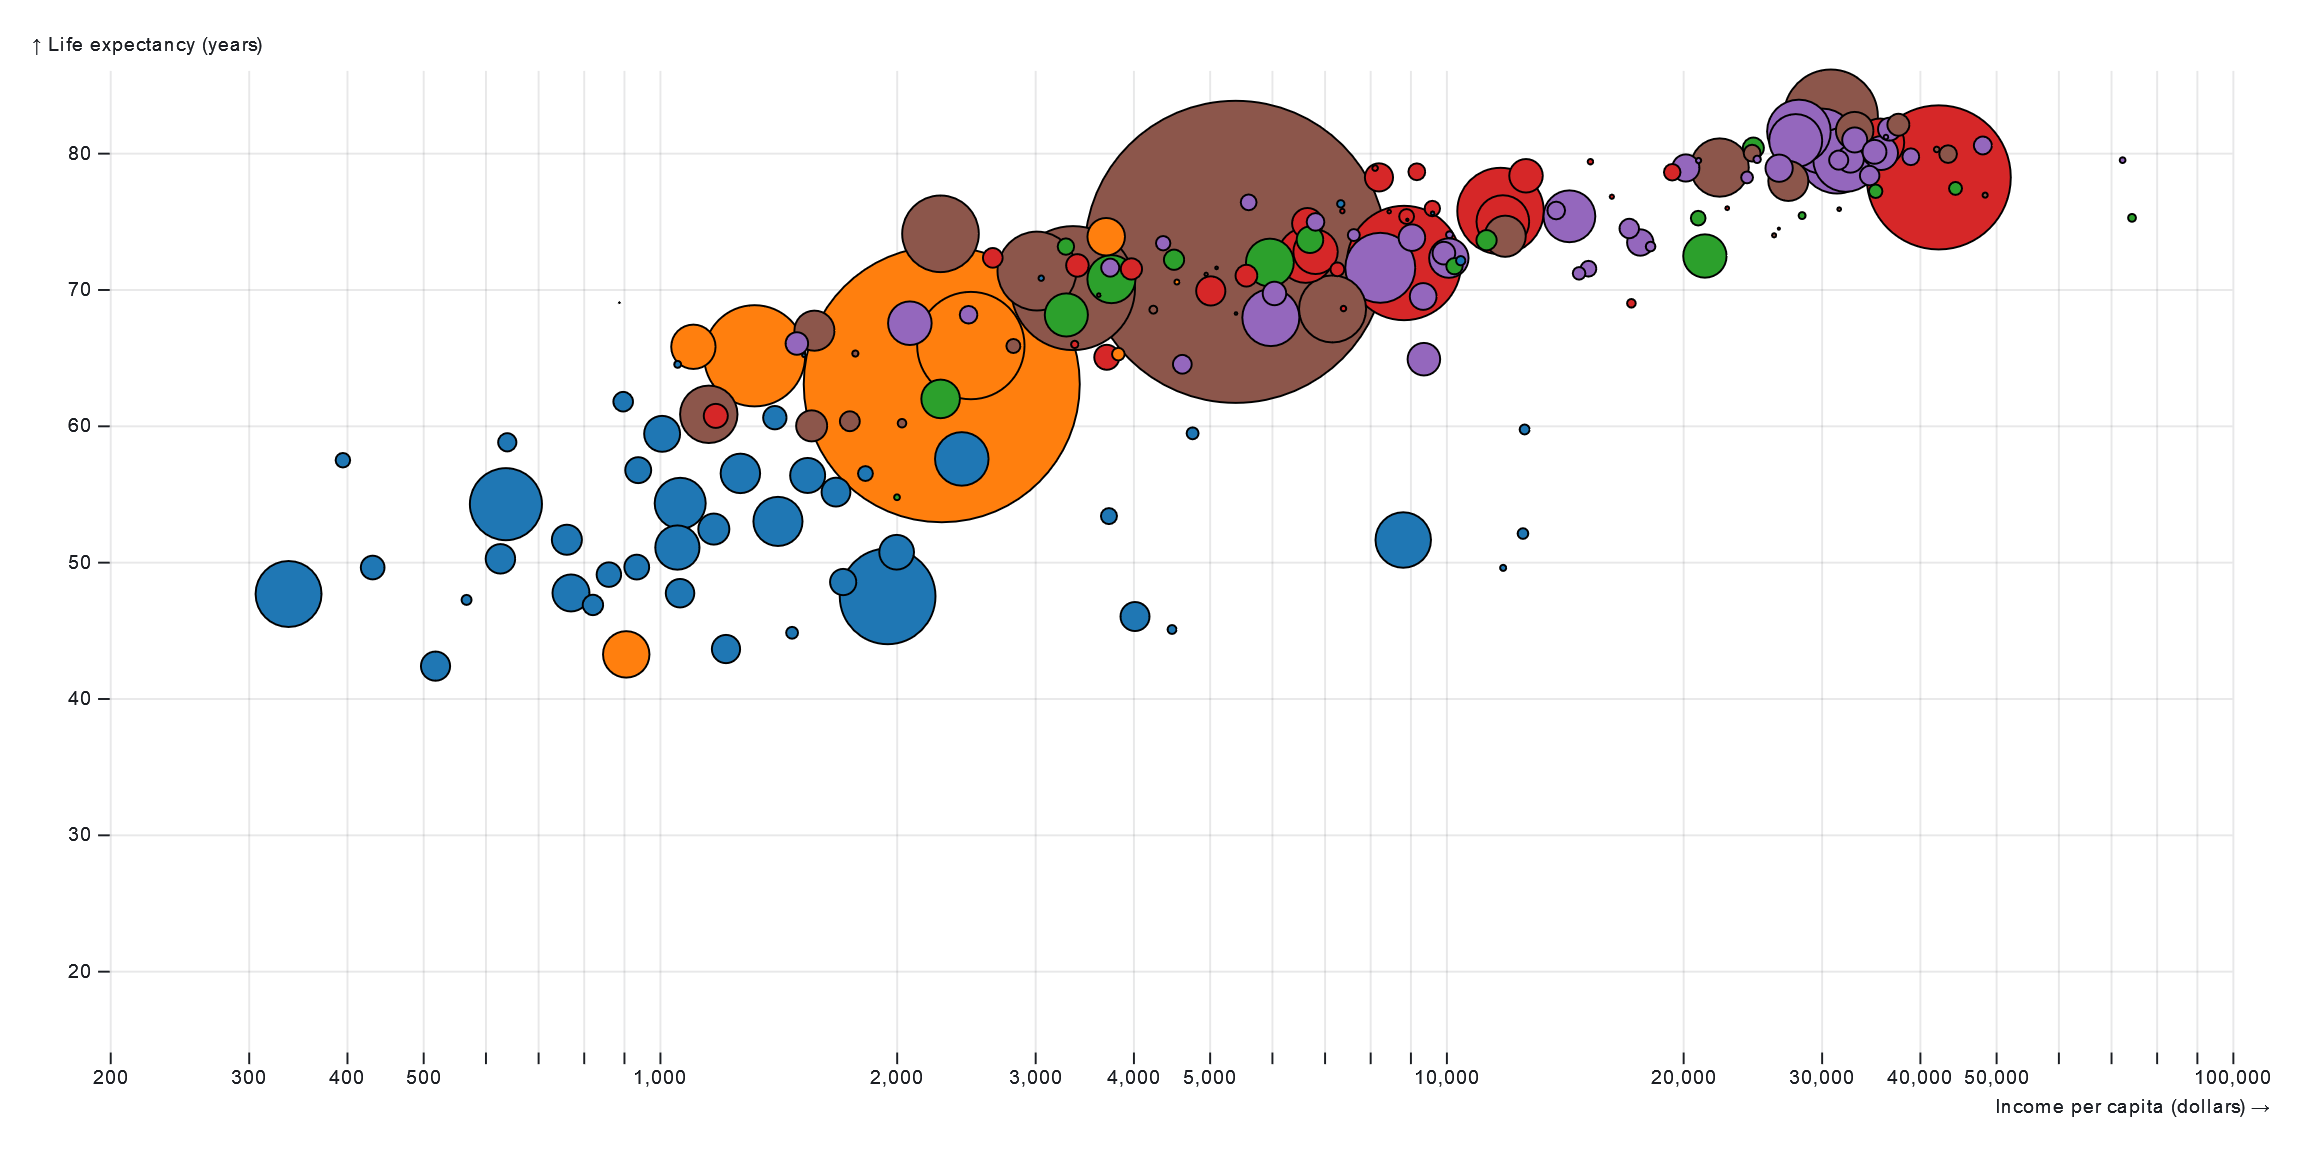
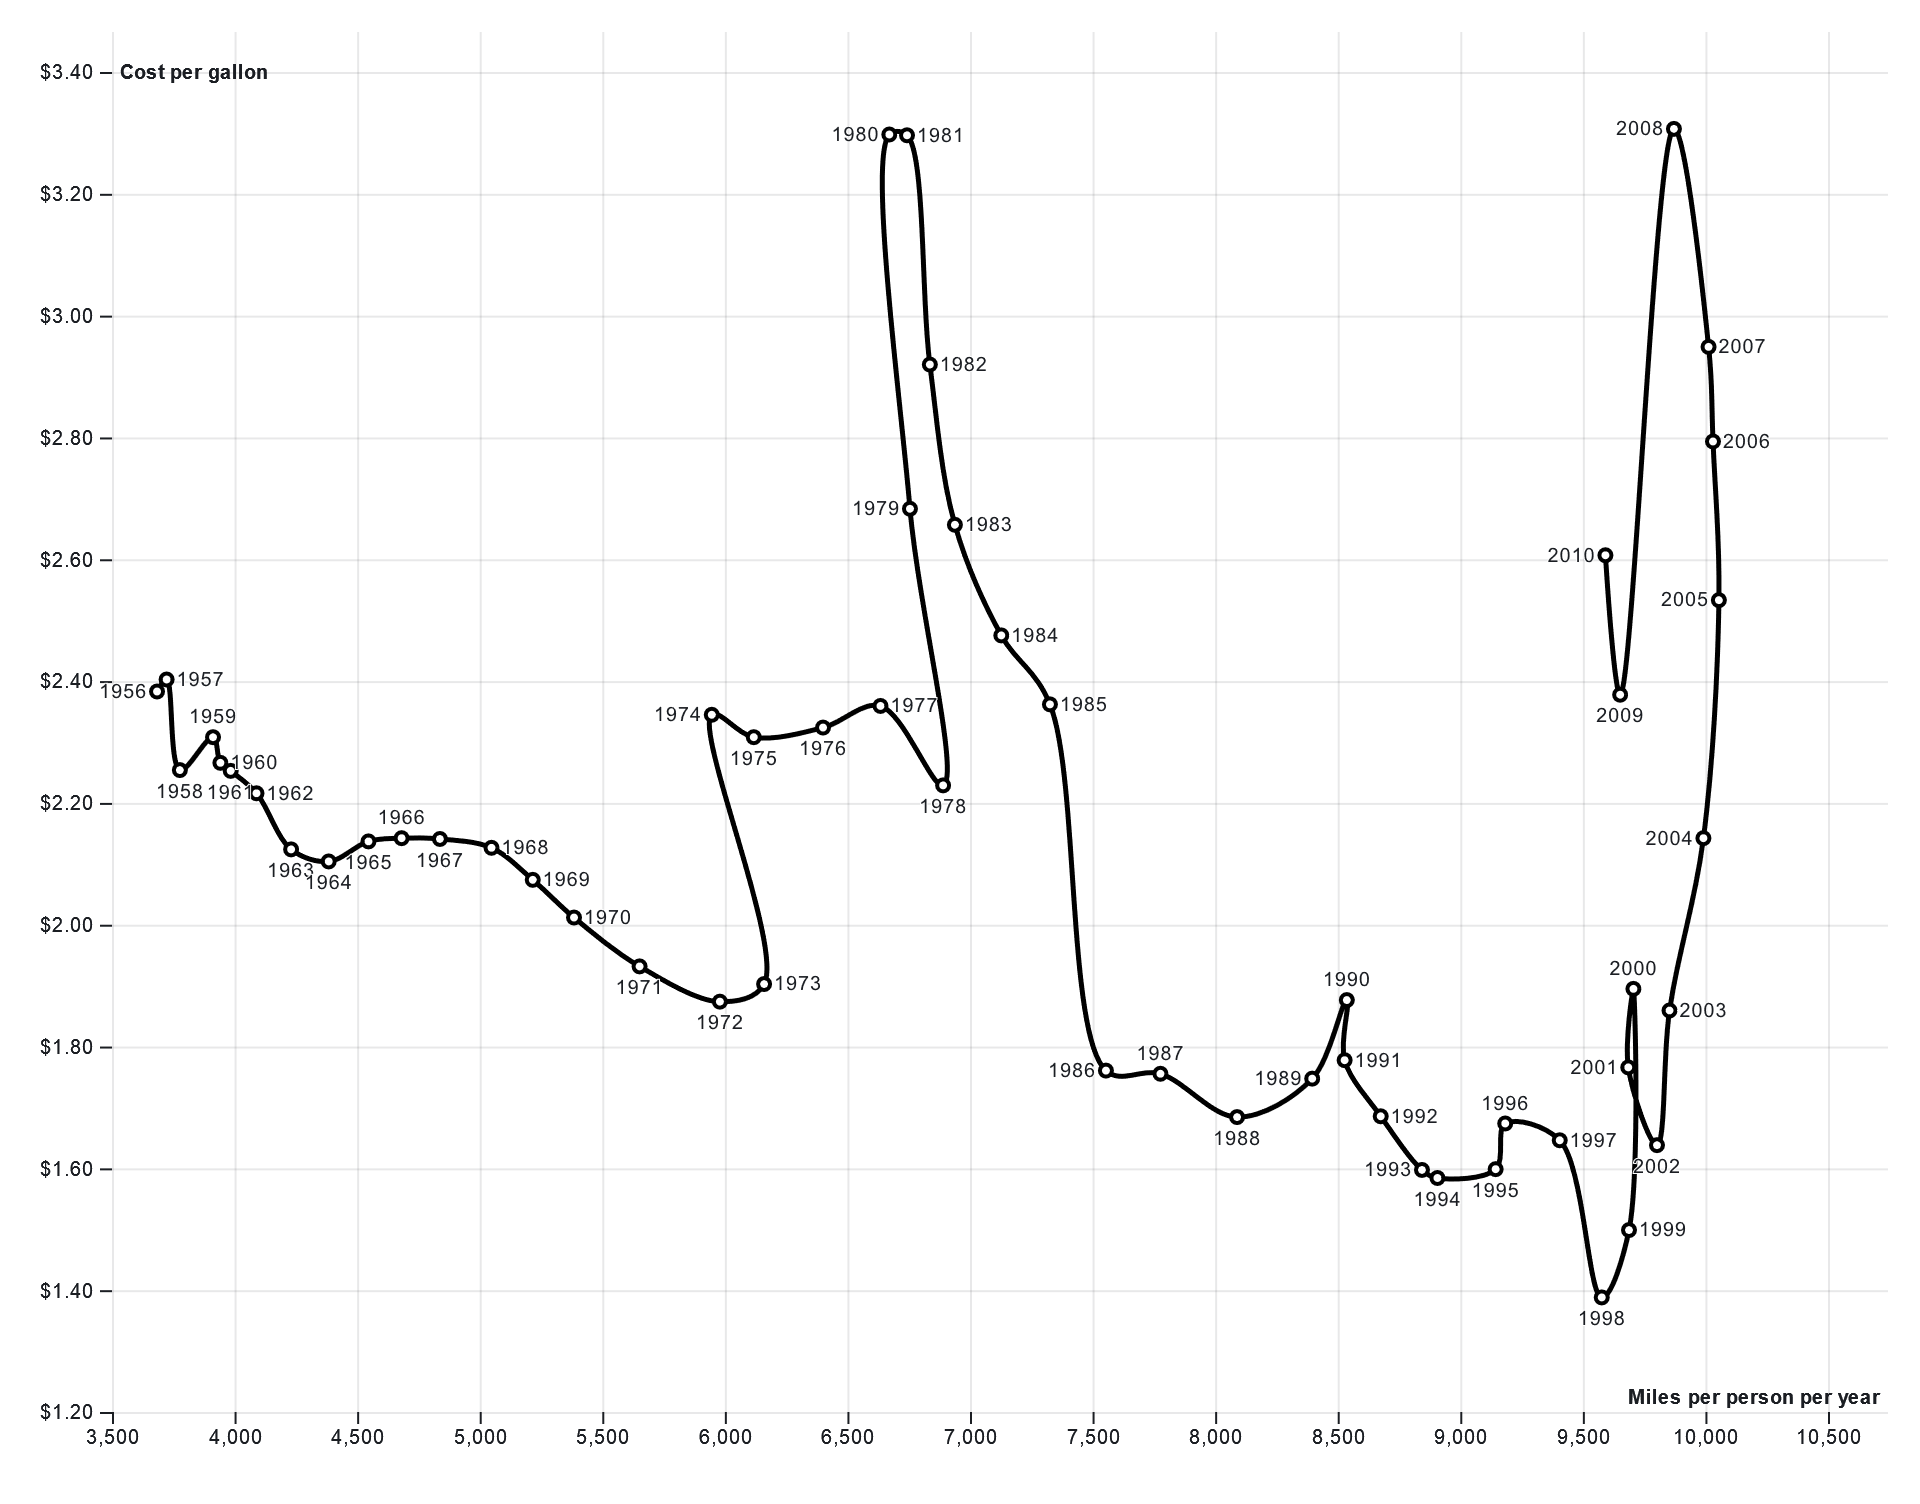
A connected scatterplot is a type of data visualization that combines elements of scatterplots and line graphs. In a connected scatterplot, individual data points are represented as markers plotted on a two-dimensional coordinate system, similar to a scatterplot. However, unlike scatterplots where data points are typically isolated, in a connected scatterplot, the data points are connected by lines. These lines create continuous trajectories, emphasizing the sequential or temporal relationship between observations. Connected scatterplots are commonly used to visualize trends, patterns, and relationships in time-series data or sequential observations. They are particularly useful for exploring how variables change over time and for identifying correlations between variables.
Uses:
- Time-Series Analysis: Visualizing changes in variables over time and identifying trends or patterns in time-series data.
- Correlation Exploration: Examining the relationship between two variables by observing the direction and strength of connections between data points.
- Temporal Sequencing: Visualizing the sequential order of events or observations to understand temporal patterns and sequences.
- Anomaly Detection: Identifying outliers or abnormal data points by observing deviations from the expected trajectory.
- Comparative Analysis: Comparing multiple datasets or groups by examining the trajectories of their data points.
- Cyclical Patterns: Visualizing cyclical or periodic patterns in the data, such as seasonal fluctuations or repetitive trends.
- Process Monitoring: Monitoring the progress or performance of a process over time and detecting any deviations from expected behavior.
- Interpolation: Estimating missing data points between observed measurements to create a more continuous representation of the data.
- Event Visualization: Visualizing the occurrence of events or incidents over time to understand their frequency, timing, and duration.
- Forecasting: Predicting future trends or outcomes based on historical data patterns and extrapolating the trajectory of the data.
Purposes:
- Trend Identification: Identifying trends and patterns in data to understand how variables change over time.
- Correlation Assessment: Assessing the relationship between two variables and determining if they are positively or negatively correlated.
- Temporal Analysis: Analyzing the temporal sequence of events or observations to uncover underlying patterns or trends.
- Outlier Detection: Detecting outliers or anomalies in the data that deviate significantly from the expected pattern.
- Pattern Recognition: Recognizing recurring patterns or cycles in the data, such as seasonal variations or periodic trends.
- Comparison between Groups: Comparing the trajectories of different groups or datasets to assess differences or similarities in behavior.
- Process Monitoring: Monitoring the progress of a process or system over time to ensure it is functioning as expected.
- Interpolation of Missing Data: Estimating missing data points by interpolating between observed measurements to create a more complete dataset.
- Event Tracking: Tracking the occurrence of specific events or incidents over time to analyze their frequency and duration.
- Prediction and Forecasting: Using historical data patterns to predict future trends or outcomes and make informed decisions based on forecasted trajectories.

Reviews
There are no reviews yet.