Description
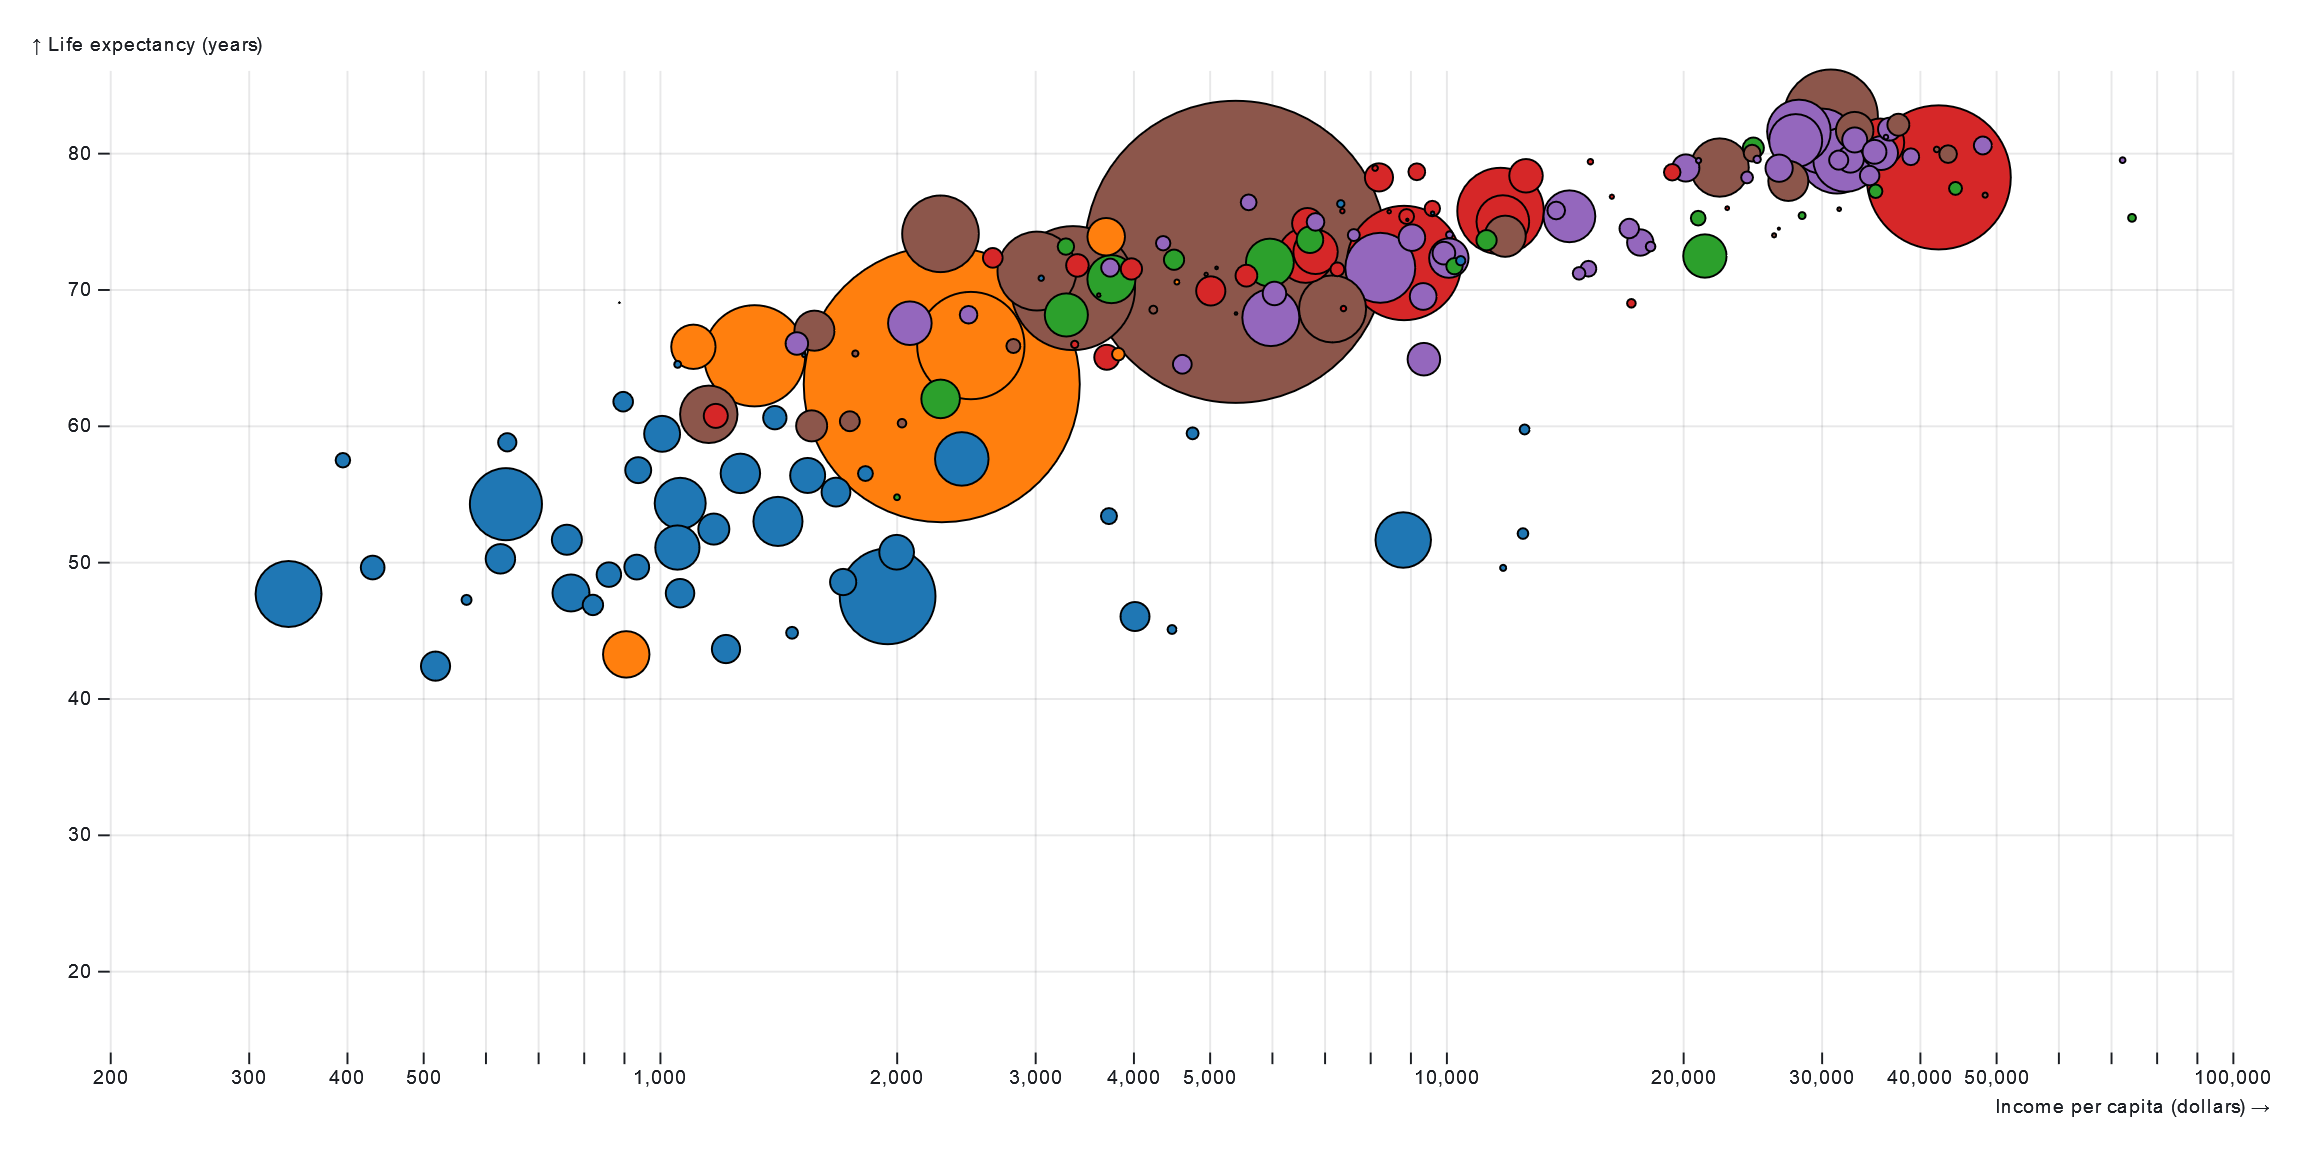
“The Wealth & Health of Nations” is a comprehensive data visualization project that explores the relationship between economic prosperity and public health across different countries and regions of the world. This visualization typically consists of interactive maps, charts, and graphs that display various indicators related to income, wealth distribution, life expectancy, healthcare spending, and disease burden. By presenting this data in a visually engaging and accessible format, “The Wealth & Health of Nations” aims to highlight disparities in economic development and healthcare outcomes globally and to facilitate a deeper understanding of the complex interplay between wealth and health at the national and international levels.
Uses:
- Policy Analysis: Governments and policymakers use the visualization to analyze the impact of economic policies on public health outcomes and vice versa.
- Academic Research: Researchers and scholars utilize the visualization to study correlations between economic indicators and health outcomes across different countries and regions.
- International Development: Development organizations and agencies use the visualization to identify regions in need of targeted interventions to improve both economic well-being and healthcare access.
- Healthcare Planning: Healthcare professionals and administrators leverage the visualization to inform resource allocation decisions and healthcare infrastructure planning.
- Education: Educators and students utilize the visualization as a teaching tool to illustrate concepts related to global health, economics, and social determinants of health.
- Advocacy: Advocacy groups and non-profit organizations use the visualization to raise awareness about disparities in wealth and health outcomes and to advocate for policy changes.
- Investment Decision-making: Investors and financial analysts use the visualization to assess the economic and health risks associated with investments in different countries or regions.
- Public Health Promotion: Public health agencies and organizations use the visualization to communicate health disparities and promote health equity initiatives.
- Comparative Analysis: Journalists and media outlets use the visualization to conduct comparative analysis and report on global health and economic trends.
- Data Exploration: General users explore the visualization to gain insights into global trends, disparities, and correlations between wealth and health indicators.
Purposes:
- Highlight Disparities: The visualization aims to highlight disparities in economic development and healthcare outcomes between countries and regions.
- Inform Decision-making: It provides policymakers, healthcare professionals, and other stakeholders with data-driven insights to inform decision-making processes.
- Raise Awareness: By visualizing complex data in an accessible format, the visualization raises awareness about global health and economic issues.
- Encourage Action: It encourages action to address inequalities in wealth and health outcomes and promote policies that support equitable development.
- Promote Transparency: The visualization promotes transparency by making data on wealth and health outcomes publicly accessible and understandable.
- Facilitate Research: Researchers use the visualization as a tool to facilitate research on the determinants of health and economic well-being.
- Support Advocacy Efforts: Advocacy groups and non-profit organizations use the visualization to support advocacy efforts aimed at improving health equity and economic justice.
- Empower Communities: By providing data on health and economic indicators, the visualization empowers communities to advocate for their own needs and interests.
- Track Progress: Governments and organizations use the visualization to track progress towards global health and development goals, such as the Sustainable Development Goals (SDGs).
- Educate the Public: The visualization serves as an educational resource to help the public better understand the complex interplay between wealth and health at the national and international levels.
Only logged in customers who have purchased this product may leave a review.
Related products
-
- Sale!
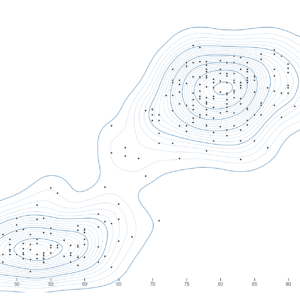
Density Contours charts
- Original price was: $ 15.$ 10Current price is: $ 10.
- Add to cart
-
- Sale!
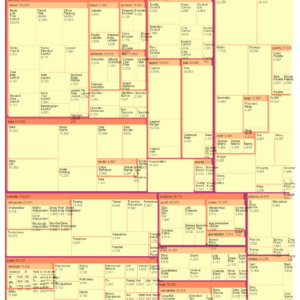
Cascaded Tree Map
- Original price was: $ 15.$ 10Current price is: $ 10.
- Add to cart
-
- Sale!
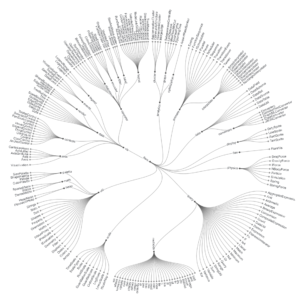
Radial Cluster Tree
- Original price was: $ 15.$ 10Current price is: $ 10.
- Add to cart
Reviews
There are no reviews yet.