Description
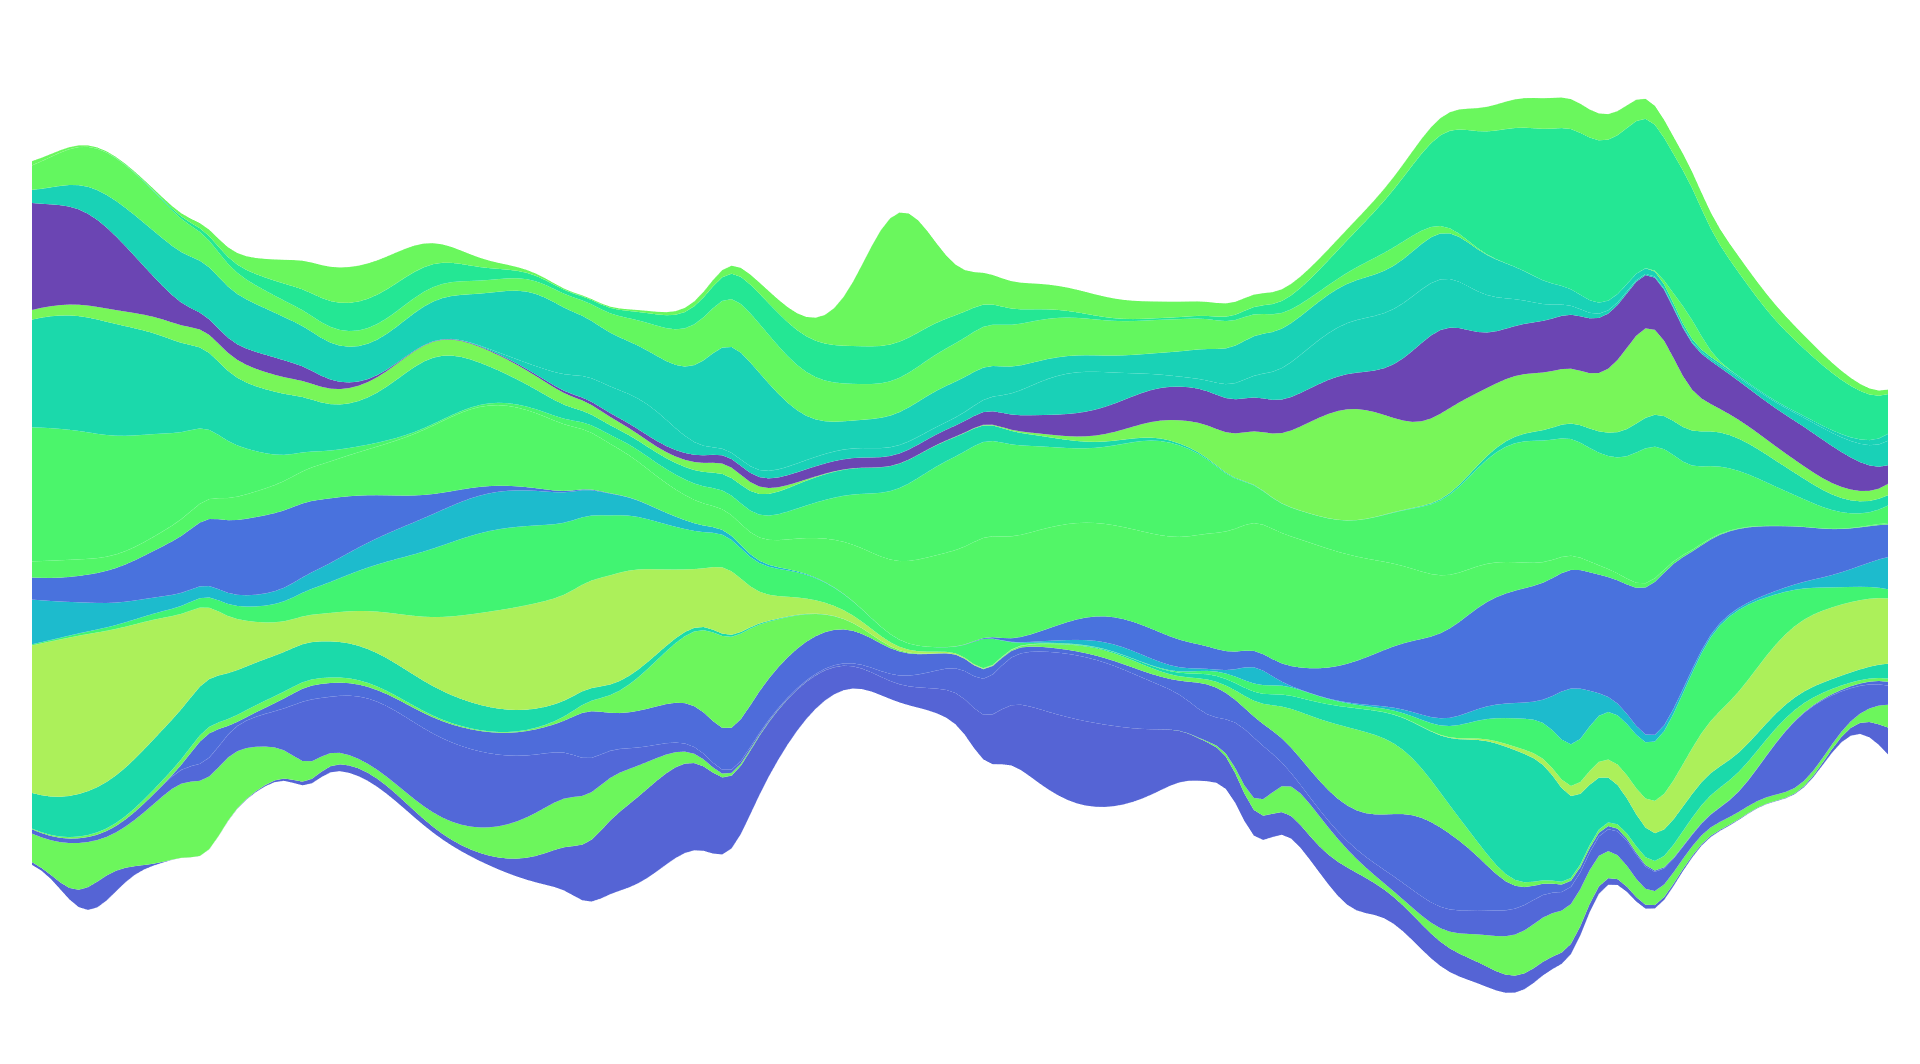
Streamgraph transitions are a dynamic data visualization technique used to represent changes in the distribution or composition of data over time. Streamgraphs are similar to stacked area charts but offer a smoother and more visually appealing representation of data transitions. In streamgraph transitions, the areas representing different categories or groups smoothly transition from one configuration to another, allowing viewers to perceive shifts in the data’s structure over time. These transitions can be animated, enabling users to track changes more effectively and understand how the distribution of data evolves over time periods. Streamgraph transitions are particularly useful for visualizing temporal data, such as changes in market shares over years, shifts in demographic trends, or variations in website traffic throughout the day.
Uses:
- Temporal Analysis: Streamgraph transitions are used to analyze changes in data distribution over time, helping users understand temporal trends and patterns.
- Market Analysis: Visualizing changes in market shares, product sales, or industry trends over time to identify emerging patterns and opportunities.
- Website Analytics: Tracking variations in website traffic, user engagement, and content popularity throughout the day or over different time intervals.
- Financial Monitoring: Monitoring changes in stock prices, investment portfolios, or financial indicators over time to inform investment decisions.
- Epidemiological Surveillance: Analyzing shifts in disease prevalence, outbreak dynamics, and epidemiological trends over time to inform public health interventions.
- Supply Chain Management: Tracking changes in inventory levels, supply chain disruptions, and demand patterns over time to optimize logistics and operations.
- Demographic Analysis: Visualizing changes in population demographics, migration patterns, and age distributions over time to inform policy-making and planning.
- Climate Data Visualization: Representing variations in climate variables, such as temperature, precipitation, and sea level, over different time periods to study climate change impacts.
- Social Media Monitoring: Analyzing trends in social media activity, hashtag usage, and user interactions over time to understand audience behavior and engagement patterns.
- Scientific Data Exploration: Visualizing temporal variations in scientific datasets, such as environmental measurements, astronomical observations, or genetic sequences, to identify patterns and phenomena.
Purposes:
- Pattern Recognition: Facilitating the identification of temporal patterns, trends, and anomalies within the data through dynamic visualization.
- Data Exploration: Supporting exploratory analysis of temporal datasets by enabling users to interactively track changes and explore different time periods.
- Trend Analysis: Analyzing long-term trends and cyclical patterns in the data to understand underlying dynamics and drivers of change.
- Comparative Analysis: Comparing the distribution of data across different time periods to assess changes in relative proportions and trends.
- Forecasting: Using historical data patterns to predict future trends and anticipate potential changes in the data distribution.
- Communication: Communicating insights and findings derived from the analysis of temporal data in a visually compelling and intuitive manner.
- Decision Support: Providing decision-makers with actionable insights and recommendations based on the analysis of temporal trends and patterns.
- Educational Tool: Serving as an educational tool for teaching concepts related to temporal data analysis, visualization techniques, and data interpretation.
- Validation: Validating hypotheses or assumptions about temporal trends and patterns by visually inspecting changes in the data distribution.
- Insight Generation: Generating new insights and understanding of complex temporal phenomena through interactive exploration and visualization of data transitions.
Only logged in customers who have purchased this product may leave a review.

Reviews
There are no reviews yet.