In the age of omnichannel commerce and dynamic consumer demand, inventory isn’t just a backend concern — it’s a strategic lever for profitability.
Retailers today are expected to maintain optimal stock levels, avoid over-purchasing, and ensure high sell-through rates — all while delivering seamless customer experiences. Achieving that balance requires real-time visibility and intelligent decision-making.
That’s where Tableau steps in.
This visual offers a comprehensive, category-level view of how products move through the supply chain — from procurement to sales to residual stock.
The Chart at a Glance
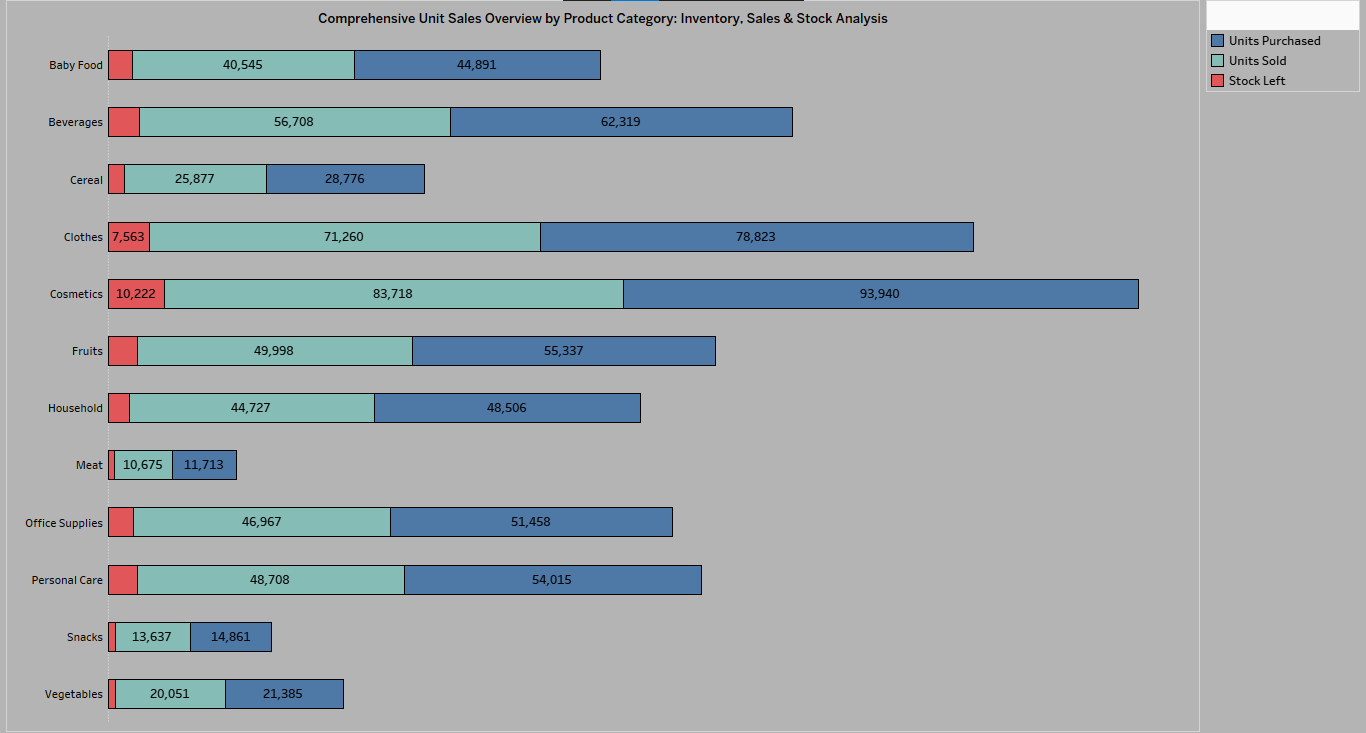
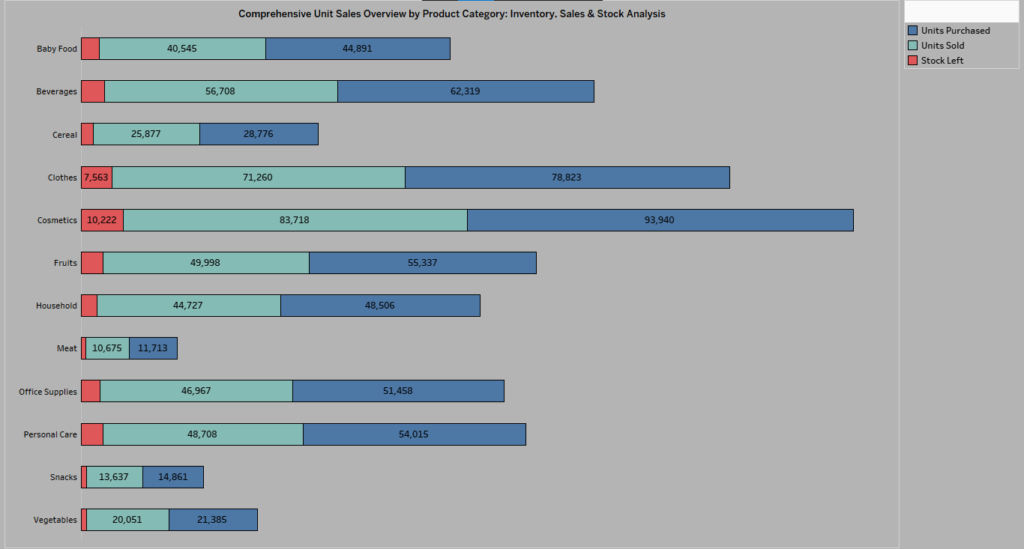
The chart featured here is a horizontal stacked bar visualization, purpose-built in Tableau to reveal product movement across multiple categories.
Each category — from Cosmetics to Office Supplies — is broken down by:
- Units Procured (Inbound Stock)
- Units Sold (Outbound Sales)
- Stock Remaining (Unliquidated Inventory)
Color-coded segments allow for instant interpretation, helping decision-makers assess performance disparities at a glance.
Interpreting the Insights: What the Data Reveals
1. High-Performing Categories
Cosmetics and Clothes are clear outliers in performance, with high volumes sold and minimal inventory left over. This signals:
- Effective demand forecasting
- Fast-moving SKUs
- Lean inventory holding
These are prime categories for reinvestment and further marketing alignment.
2. Inventory Risk Zones
Meat, Cereal, and Snacks display significant unsold stock relative to units sold. This indicates:
- Potential overstocking
- Market misalignment
- Inefficient space and capital allocation
These categories warrant immediate strategic action — either through discounting, bundling, or procurement slowdown.
3. Well-Balanced Flows
Categories such as Fruits, Personal Care, and Household maintain equilibrium between incoming stock and outgoing sales — a hallmark of mature inventory management.
4. Business Implications: From Reporting to Optimization
This visualization isn’t just a performance snapshot — it’s an operational command center.
Here’s what actionable intelligence looks like:
| Insight Type | Recommended Action |
|---|---|
| Overstock Detected | Run clearance campaigns / adjust pricing |
| Strong Sell-Through | Increase POs / Invest in marketing |
| High Inventory + Low Sales | Re-evaluate sourcing / Test new demand levers |
| Balanced Performance | Maintain strategy / Monitor quarterly shifts |
With Tableau’s live connections and drill-down capabilities, such dashboards empower cross-functional teams to align on KPIs, stock thresholds, and promotional planning in real time.
Strategic Takeaways
- Procurement Alignment: Align purchase orders with sales trends — not assumptions.
- Shelf Space Optimization: Redirect warehouse and shelf space from underperforming SKUs.
- Sales Acceleration: Use performance data to power intelligent promotions.
- Cross-Departmental Clarity: Enable operations, sales, and finance teams to make unified decisions.
Why Tableau Is the Game-Changer
Traditional reports struggle to convey relationships between purchase, sale, and surplus. Tableau translates complex, multi-dimensional data into intuitive, interactive visuals. Key advantages include:
- Real-time interactivity
- Drill-down analysis by category or region
- Integration with ERP, CRM, and POS systems
- Custom KPI alerts and forecasting models
Retailers leveraging tools like Tableau gain not just insights — but competitive edge.
Final Thought
Inventory tells a story — Tableau helps you read it.
From uncovering inefficiencies to doubling down on what works, category-level insights like these are essential for agile, profitable retail operations.
If your team is still relying on static Excel sheets or delayed reporting, it’s time to modernize. A tailored Tableau Chart could be your most powerful decision-support asset.