Description
Description:
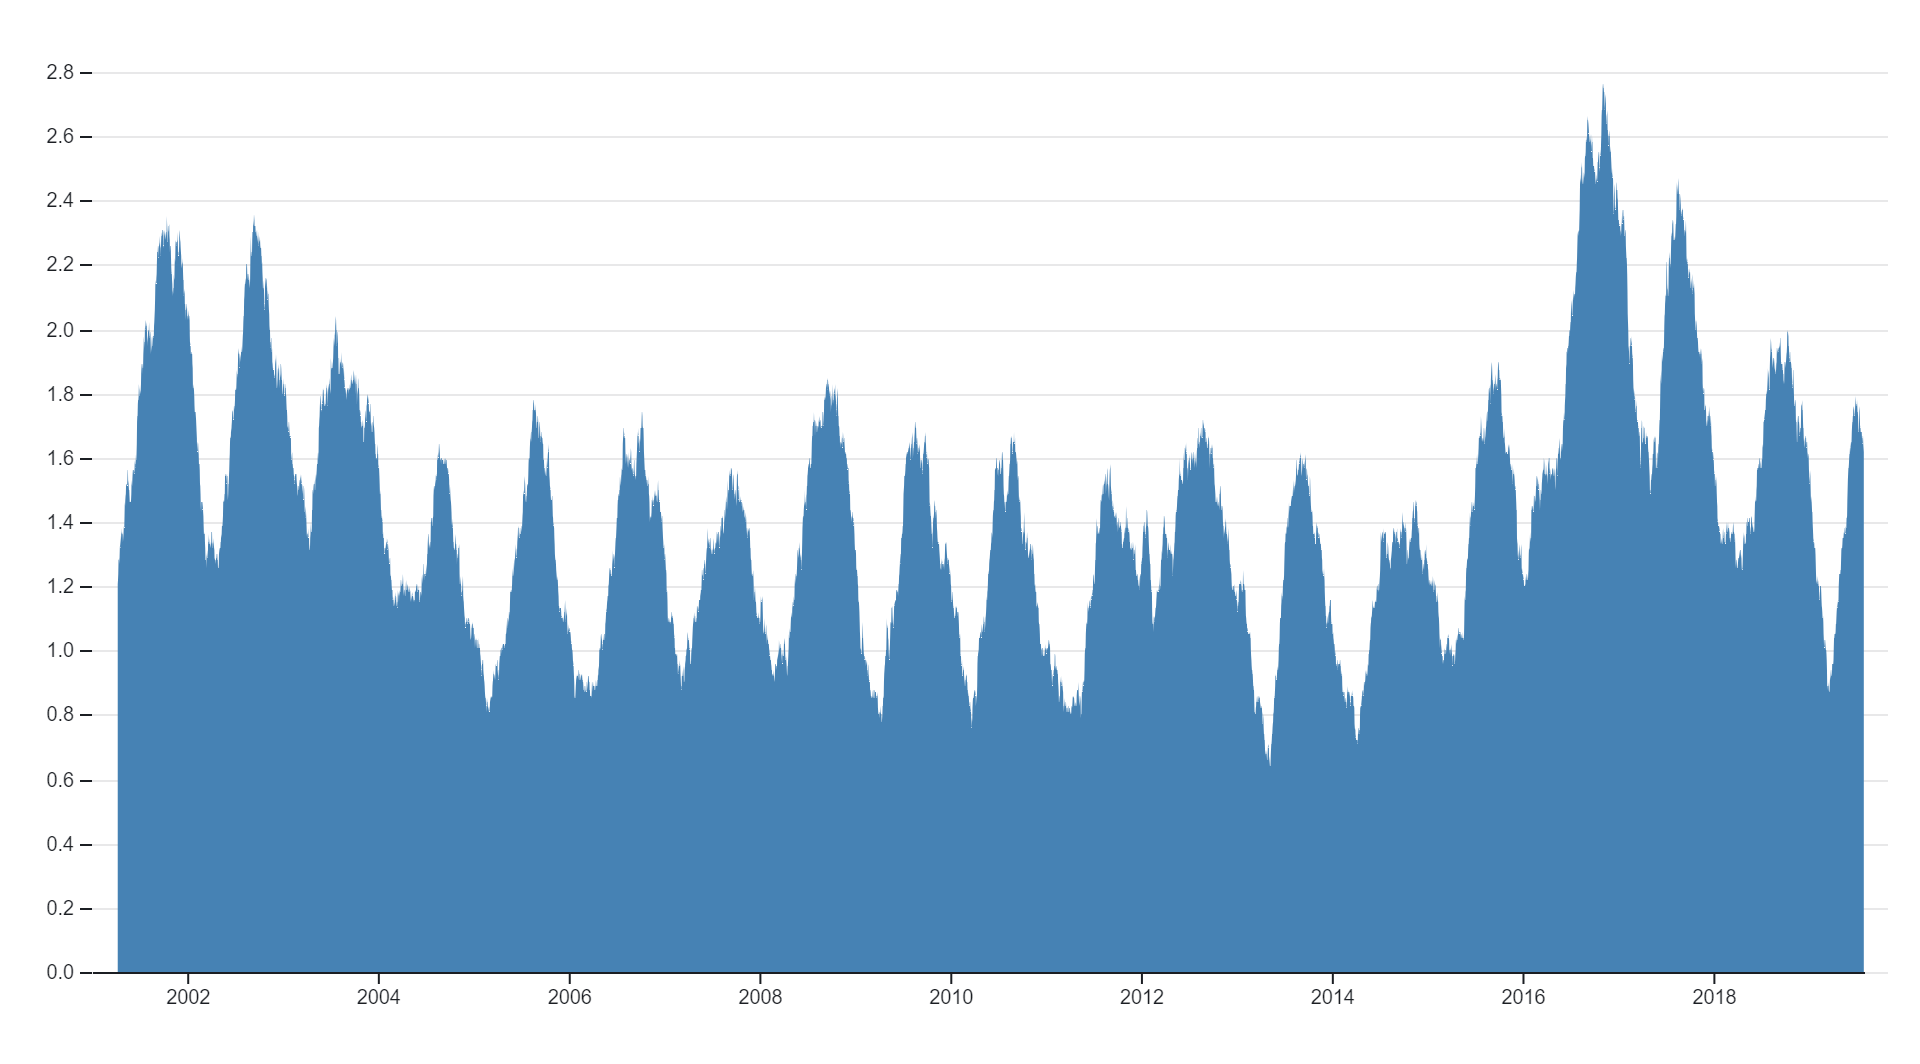
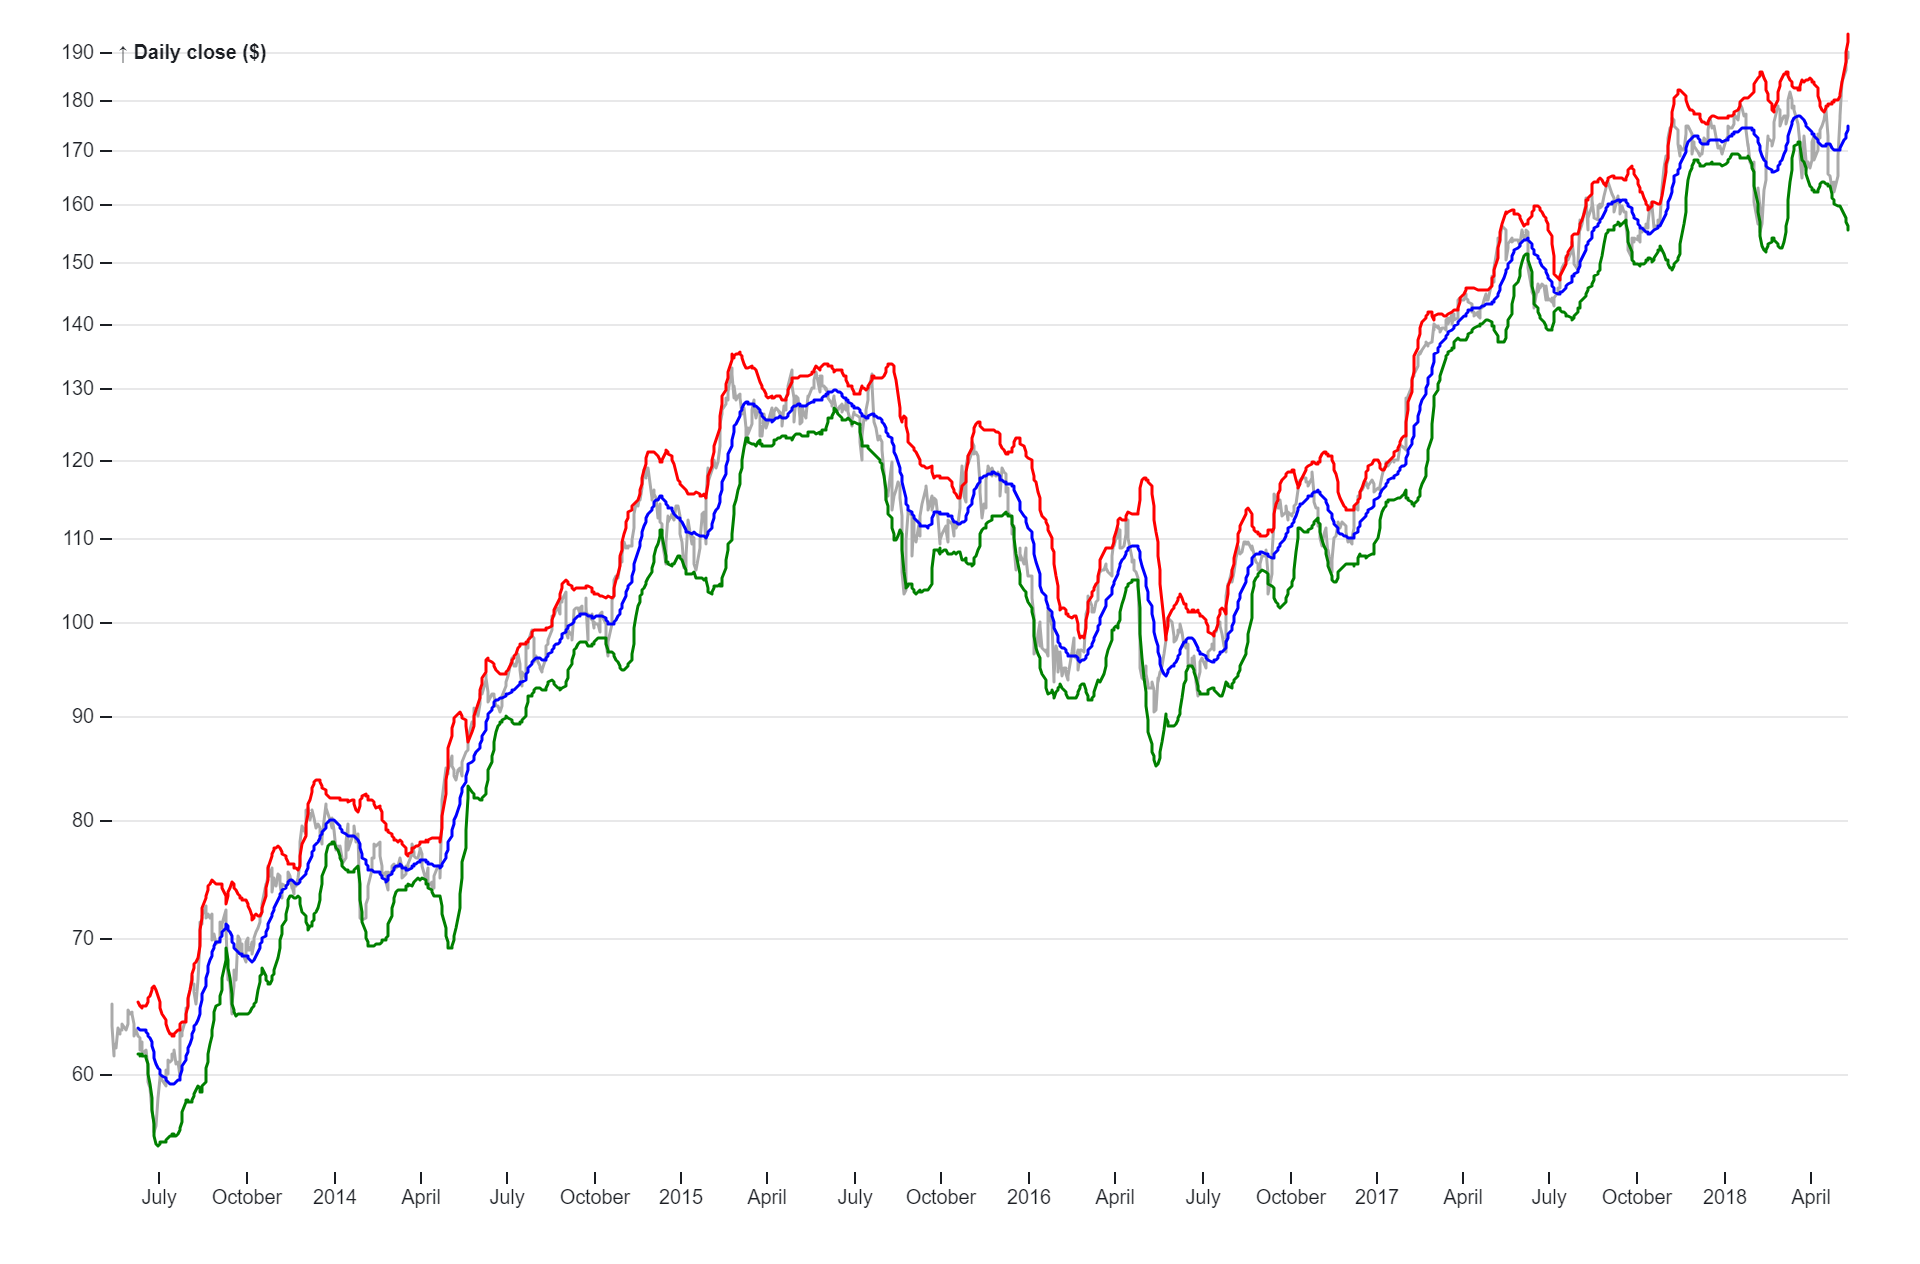
Bollinger Bands are a type of statistical chart characterizing the prices and volatility over time of a financial instrument. They were invented by John Bollinger in the 1980s. A Bollinger Band consists of a middle band (which is a moving average) and an upper and lower band. These upper and lower bands are set above and below the moving average by a certain number of standard deviations of price, thus incorporating volatility.
Purposes:
1. Provide a relative definition of high and low prices of a market.
2. Help traders identify sharp, short-term price movements.
3. Assist in determining potential entry and exit points.
4. Evaluate price action and a stock’s volatility.
5. Indicate the volatility of a stock (narrower bands indicate less volatility while wider ones indicate higher volatility).
6. Help in comparing a stock’s position relative to the bands.
7. Aid in rigorous pattern recognition.
8. Useful in comparing price action to the action of indicators to arrive at systematic trading decisions.
9. Generate oversold or overbought signals.
10. Inform trading decisions, control automated trading systems, or as a component of technical analysis.
Uses:
1. Generate signals for securities that are oversold or overbought.
2. Identify overbought or oversold market conditions.
3. Monitor for breakouts.
4. Determine how strongly a security is rising (uptrend) and when it’s potentially losing strength or reversing.
5. Identify potential entry or exit points based on deviations from the norm.
6. Gauge trends.
7. Identify when an asset is oversold or overbought.
8. Used in many markets, including stocks, futures, and currencies.
9. Identify “The Squeeze”, a popular strategy.
10. Used on most financial time series, including equities, indices, foreign exchange, commodities, futures, options and bonds.
Only logged in customers who have purchased this product may leave a review.
Related products
-
- Sale!
Tidy Tree
- Original price was: $ 15.$ 10Current price is: $ 10.
- Add to cart
-
- Sale!
Clustre Dendogram
- Original price was: $ 15.$ 10Current price is: $ 10.
- Add to cart
-
- Sale!
Radial Tidy Tree
- Original price was: $ 15.$ 10Current price is: $ 10.
- Add to cart
Reviews
There are no reviews yet.