Description
Description:
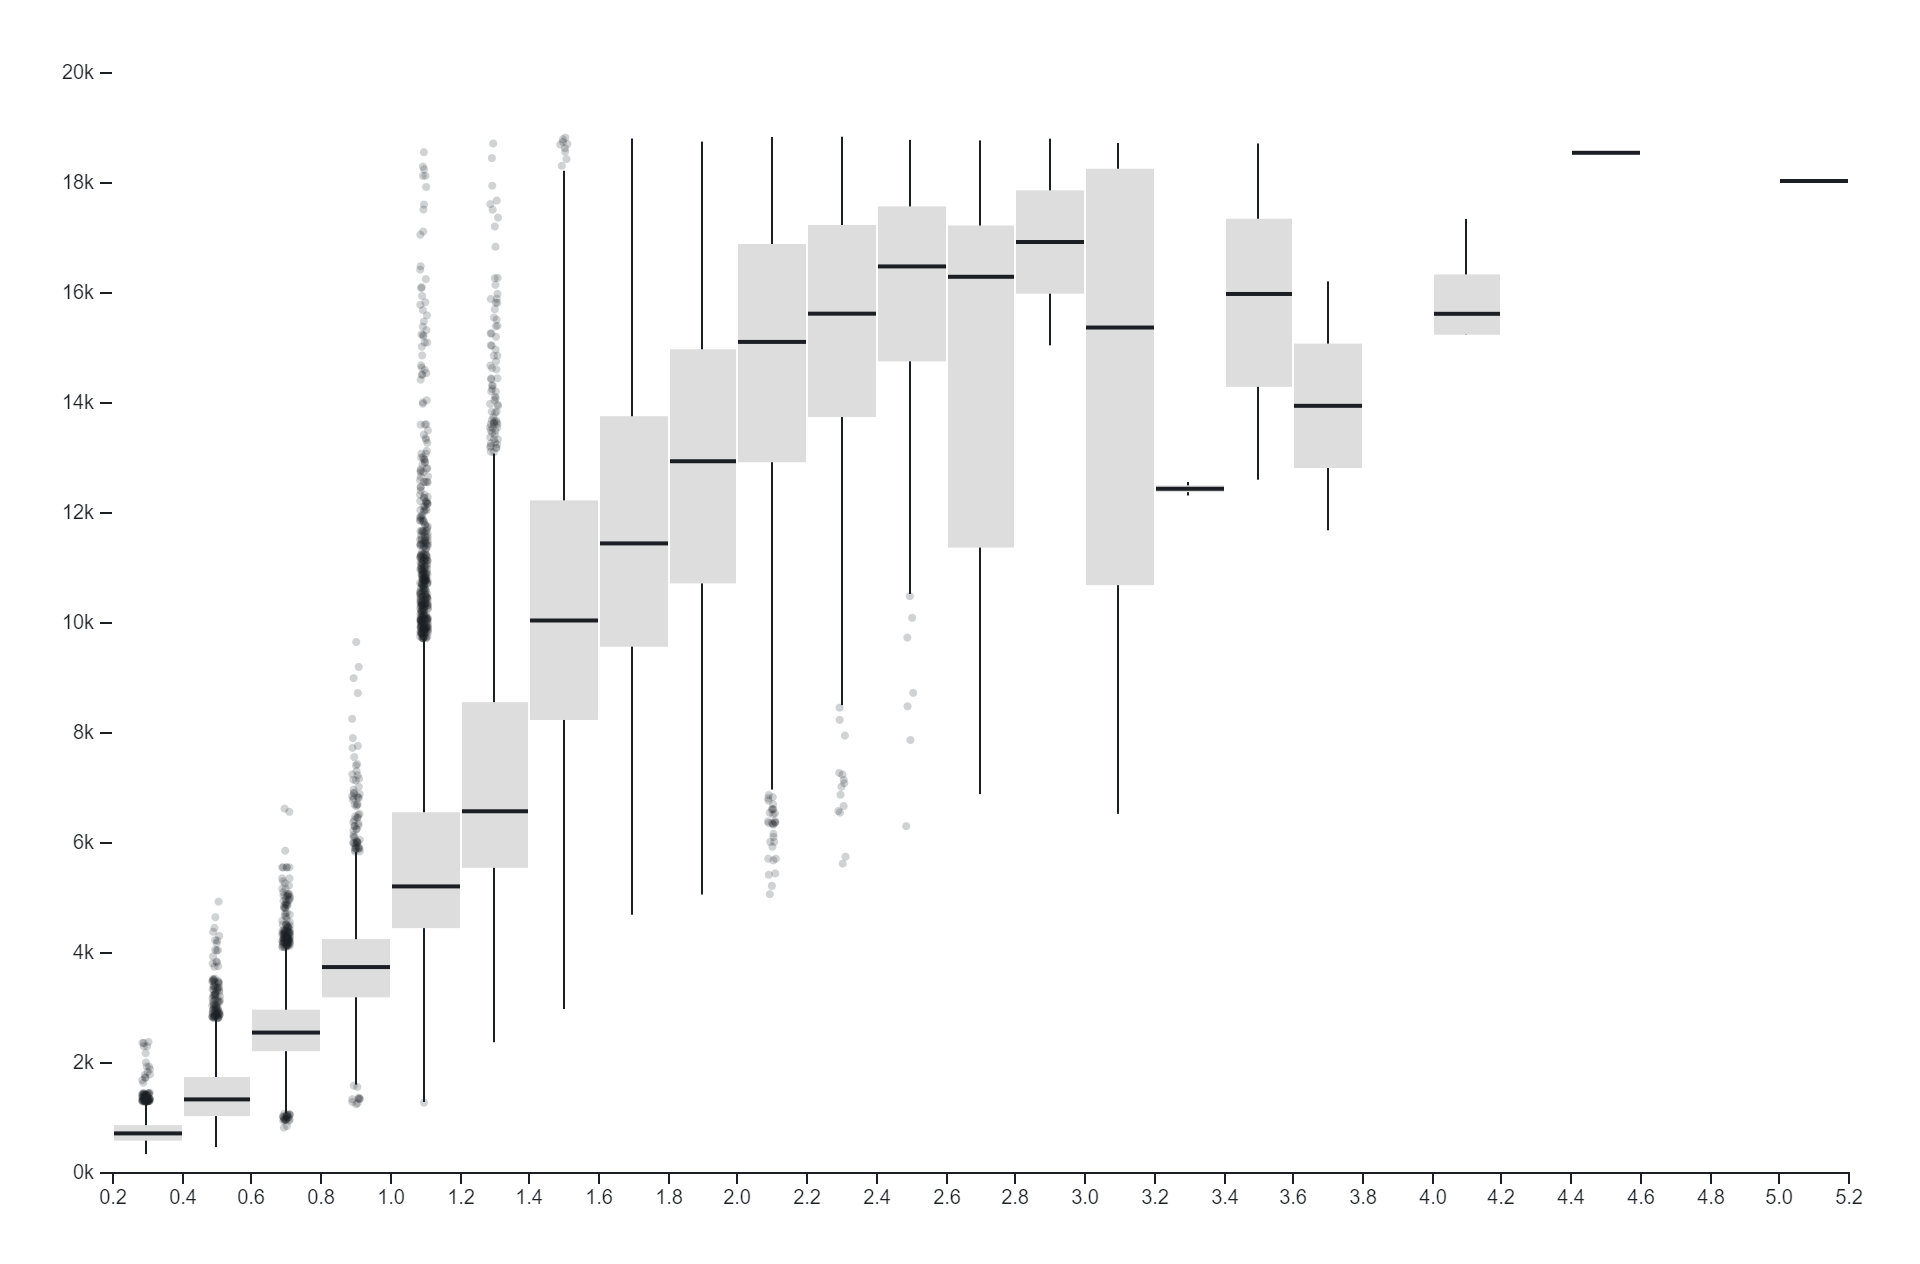
A Box Plot, also known as a Box and Whisker Plot, is a type of chart often used in explanatory data analysis. It visually depicts the distribution of numerical data and skewness by displaying the data quartiles (or percentiles) and averages. A Box Plot shows the five-number summary of a set of data, including the minimum score, first (lower) quartile, median, third (upper) quartile, and maximum score.
Purposes:
1. Provide a relative definition of high and low prices of a market.
2. Help traders identify sharp, short-term price movements.
3. Assist in determining potential entry and exit points.
4. Evaluate price action and a stock’s volatility.
5. Indicate the volatility of a stock (narrower bands indicate less volatility while wider ones indicate higher volatility).
6. Help in comparing a stock’s position relative to the bands.
7. Aid in rigorous pattern recognition.
8. Useful in comparing price action to the action of indicators to arrive at systematic trading decisions.
9. Generate oversold or overbought signals.
10. Inform trading decisions, control automated trading systems, or as a component of technical analysis.
Uses:
1. Generate signals for securities that are oversold or overbought.
2. Identify overbought or oversold market conditions.
3. Monitor for breakouts.
4. Determine how strongly a security is rising (uptrend) and when it’s potentially losing strength or reversing.
5. Identify potential entry or exit points based on deviations from the norm.
6. Gauge trends.
7. Identify when an asset is oversold or overbought.
8. Used in many markets, including stocks, futures, and currencies¹².
9. Identify “The Squeeze”, a popular strategy.
10. Used on most financial time series, including equities, indices, foreign exchange, commodities, futures, options and bonds.
Only logged in customers who have purchased this product may leave a review.
Related products
-
- Sale!
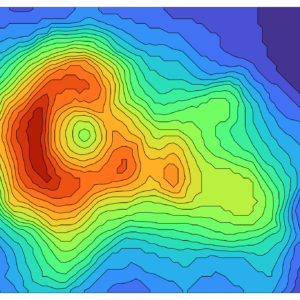
Volcano Contours
- Original price was: $ 15.$ 10Current price is: $ 10.
- Add to cart
-
- Sale!
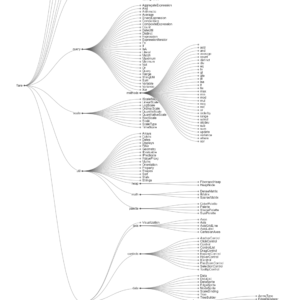
Tidy Tree
- Original price was: $ 15.$ 10Current price is: $ 10.
- Add to cart
-
- Sale!
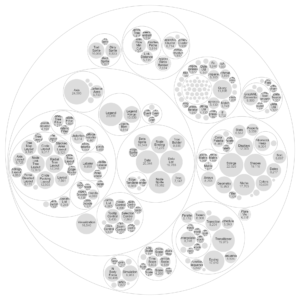
Circle Packing
- Original price was: $ 15.$ 10Current price is: $ 10.
- Add to cart
Reviews
There are no reviews yet.