
Description
Description:
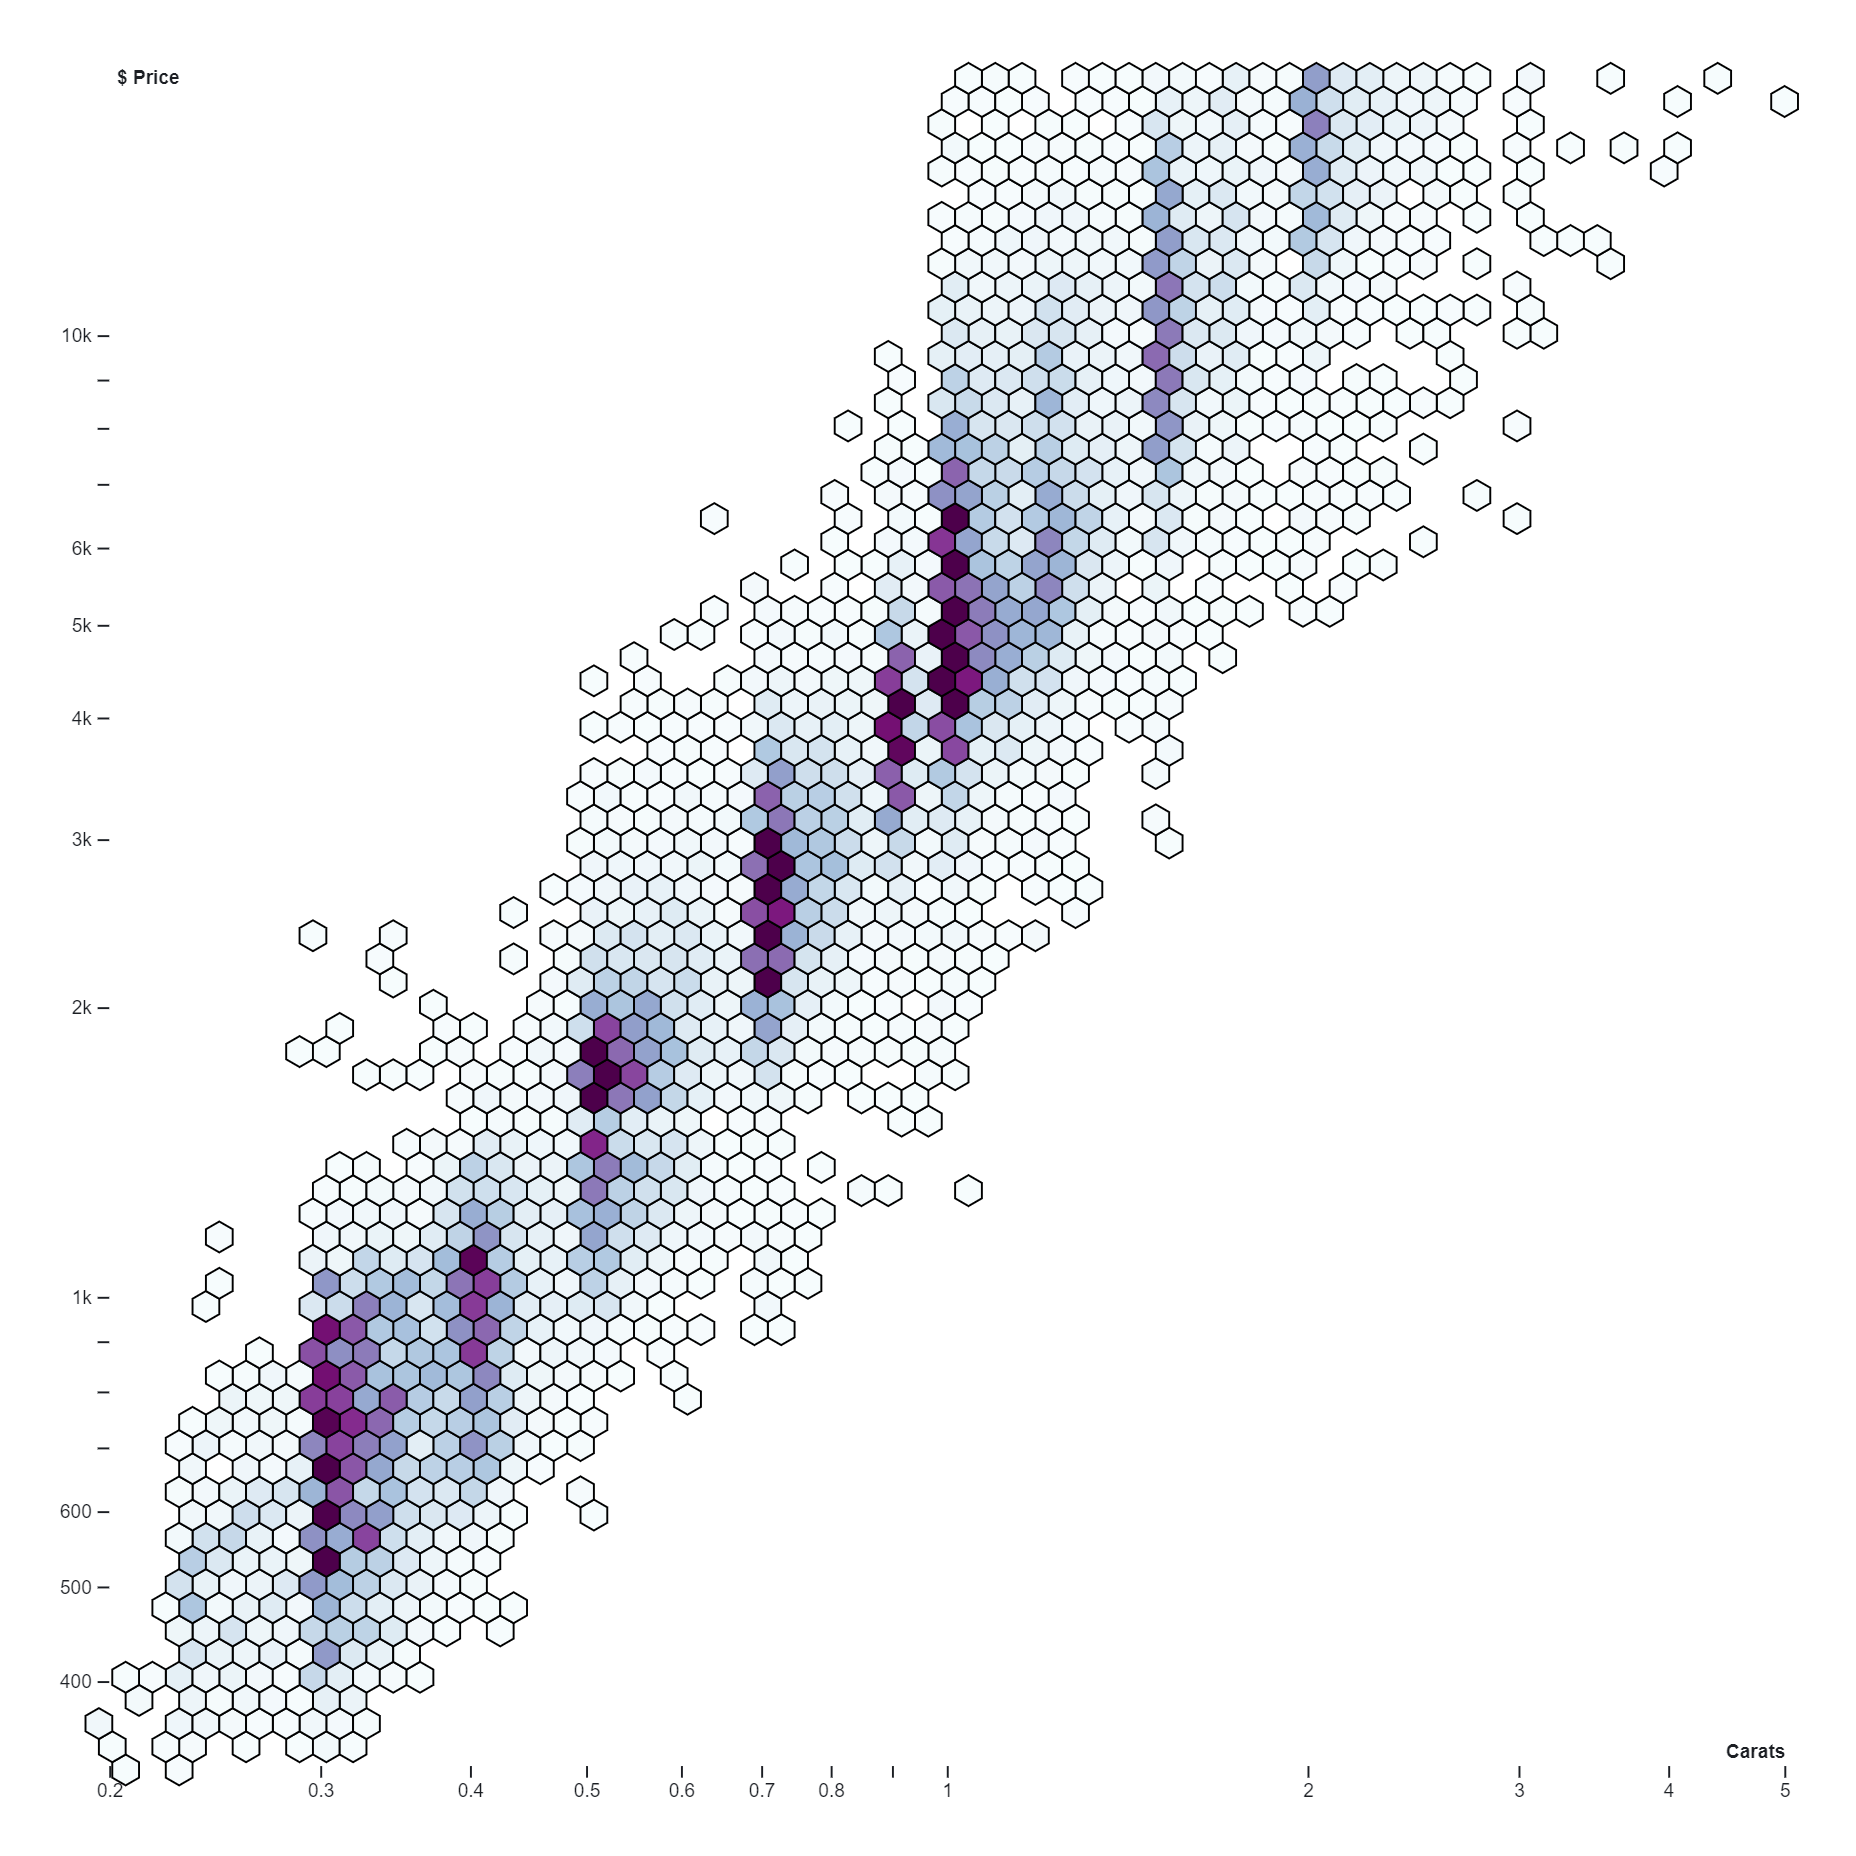
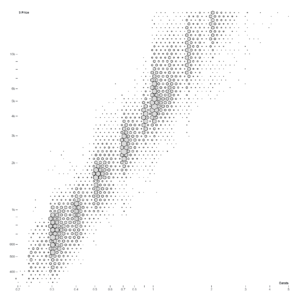
A Hexbin chart is a two-dimensional representation of data where the data points are binned into hexagonal containers. It is often used as an alternative to scatter plots when the data set is too large. The chart is divided into a grid of hexagons, and each point falls into a hexagon based on its values. The color of each hexagon represents the density of the points within it, which helps in identifying patterns in dense datasets. The grid size can be adjusted, with the default being 100 hexagons for the X-axis. The number of bins can also be specified, allowing for more granular categorization. The alpha argument can be used to adjust the transparency of the hexagons, which can be particularly useful when the color palette is dark. This type of chart is especially useful for visualizing the relationship between two numerical variables in large datasets. In Python, the `matplotlib` library provides a function named `hexbin` for creating Hexbin charts.
Uses:
1. Traffic Analysis: Hexbin charts can be used to analyze traffic data, showing the density of vehicles or incidents in different areas.
2. Population Studies: They can be used in demographic studies to visualize population density across different regions.
3. Astronomy: In astronomy, hexbin charts can be used to represent the density of stars in different regions of the sky.
4. Environmental Science: They can be used to visualize the distribution of species in an ecosystem or the concentration of pollutants in an environment.
5. Healthcare: In healthcare, hexbin charts can be used to visualize the spread of diseases or the distribution of healthcare facilities.
6. Market Research: They can be used in market research to visualize the density of customers or sales in different regions.
7. Urban Planning: Hexbin charts can be used in urban planning to visualize the distribution of various facilities or resources.
8. Geology: In geology, they can be used to visualize the distribution of minerals or geological features.
9. Social Media Analysis: Hexbin charts can be used to analyze social media data, showing the density of posts or interactions in different topics.
10.Crime Analysis: In law enforcement, hexbin charts can be used to visualize the density of crime incidents in different areas.
Purposes:
1. Data Density Representation: Hexbin charts are used to represent the density of data points in a two-dimensional space.
2. Overplotting Avoidance: They help in avoiding overplotting when dealing with large amounts of data.
3. Pattern Discovery: Hexbin charts can reveal patterns, trends, and relationships in dense datasets.
4. Spatial Data Visualization: They are particularly useful in geospatial data visualization, where the spatial location of data points is important.
5. Correlation Analysis: Hexbin charts can be used to analyze correlations between two numerical variables.
6. Data Distribution Visualization: They provide a way to visualize how data is distributed across a plane.
7. Outlier Detection: Hexbin charts can help in identifying outliers in the data.
8. Data Comparison: They can be used to compare the distributions of two different datasets.
9. Complex Data Simplification: Hexbin charts can simplify the representation of complex multivariate data.
10. Effective Communication: They can effectively communicate the findings of a data analysis to a non-technical audience.
Only logged in customers who have purchased this product may leave a review.
Related products
-
- Sale!
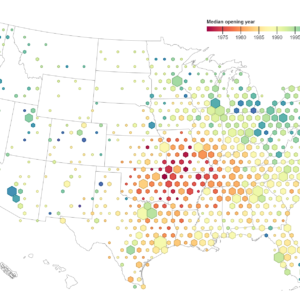
Hexbin Map
- Original price was: $ 15.$ 10Current price is: $ 10.
- Add to cart
-
- Sale!
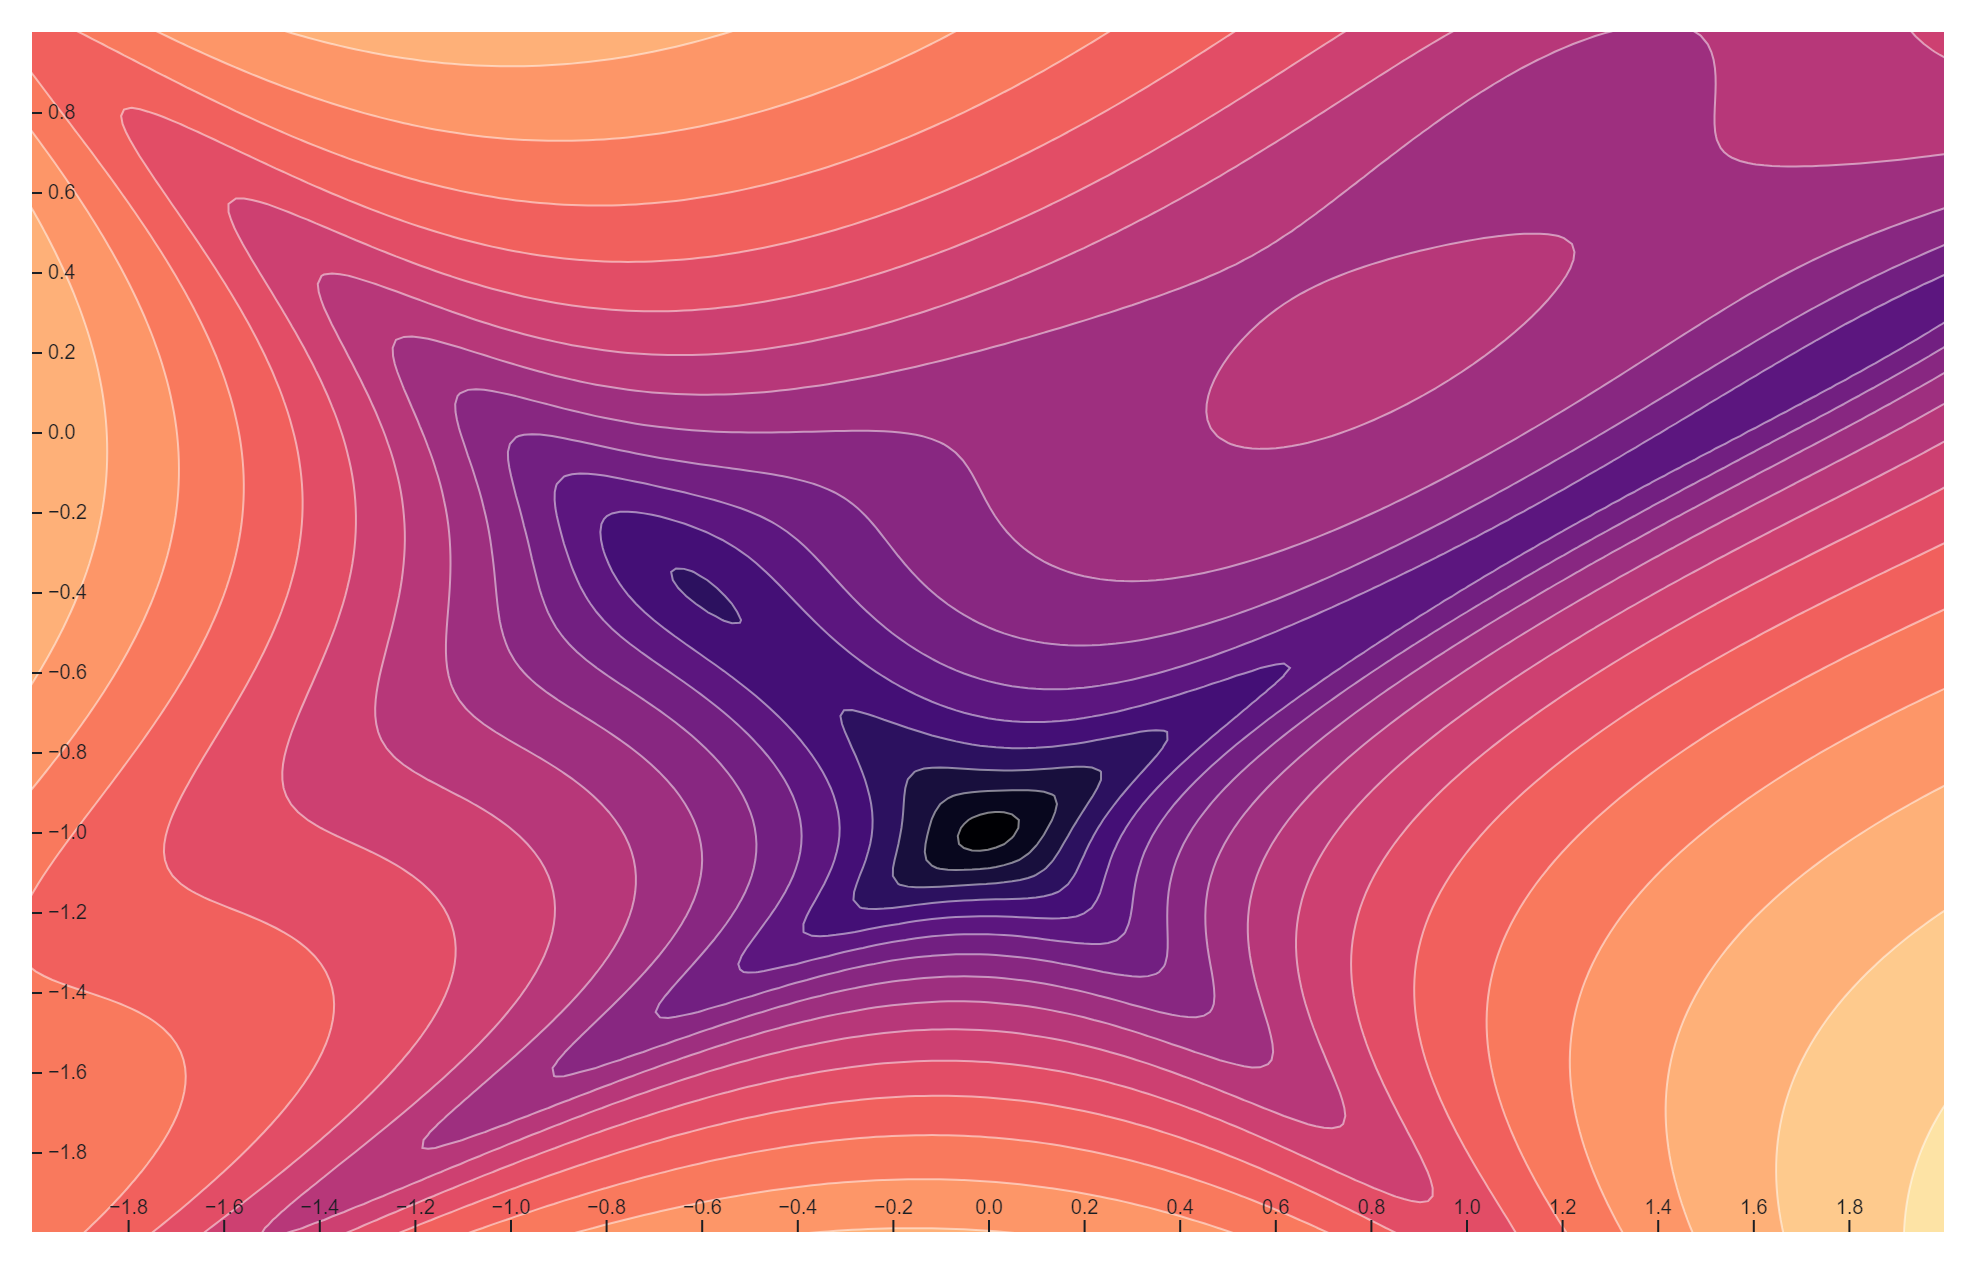
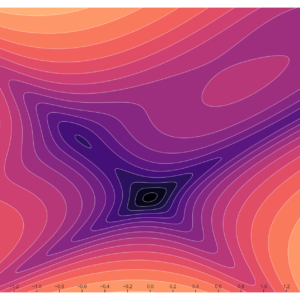
Contours
- Original price was: $ 15.$ 10Current price is: $ 10.
- Add to cart
-
- Sale!
- Original price was: $ 15.$ 10Current price is: $ 10.
- Add to cart
Reviews
There are no reviews yet.