Description:
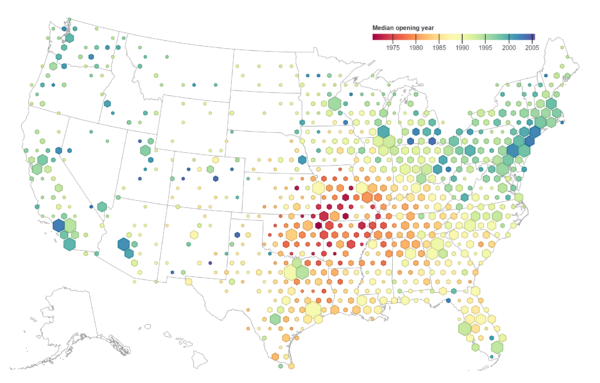
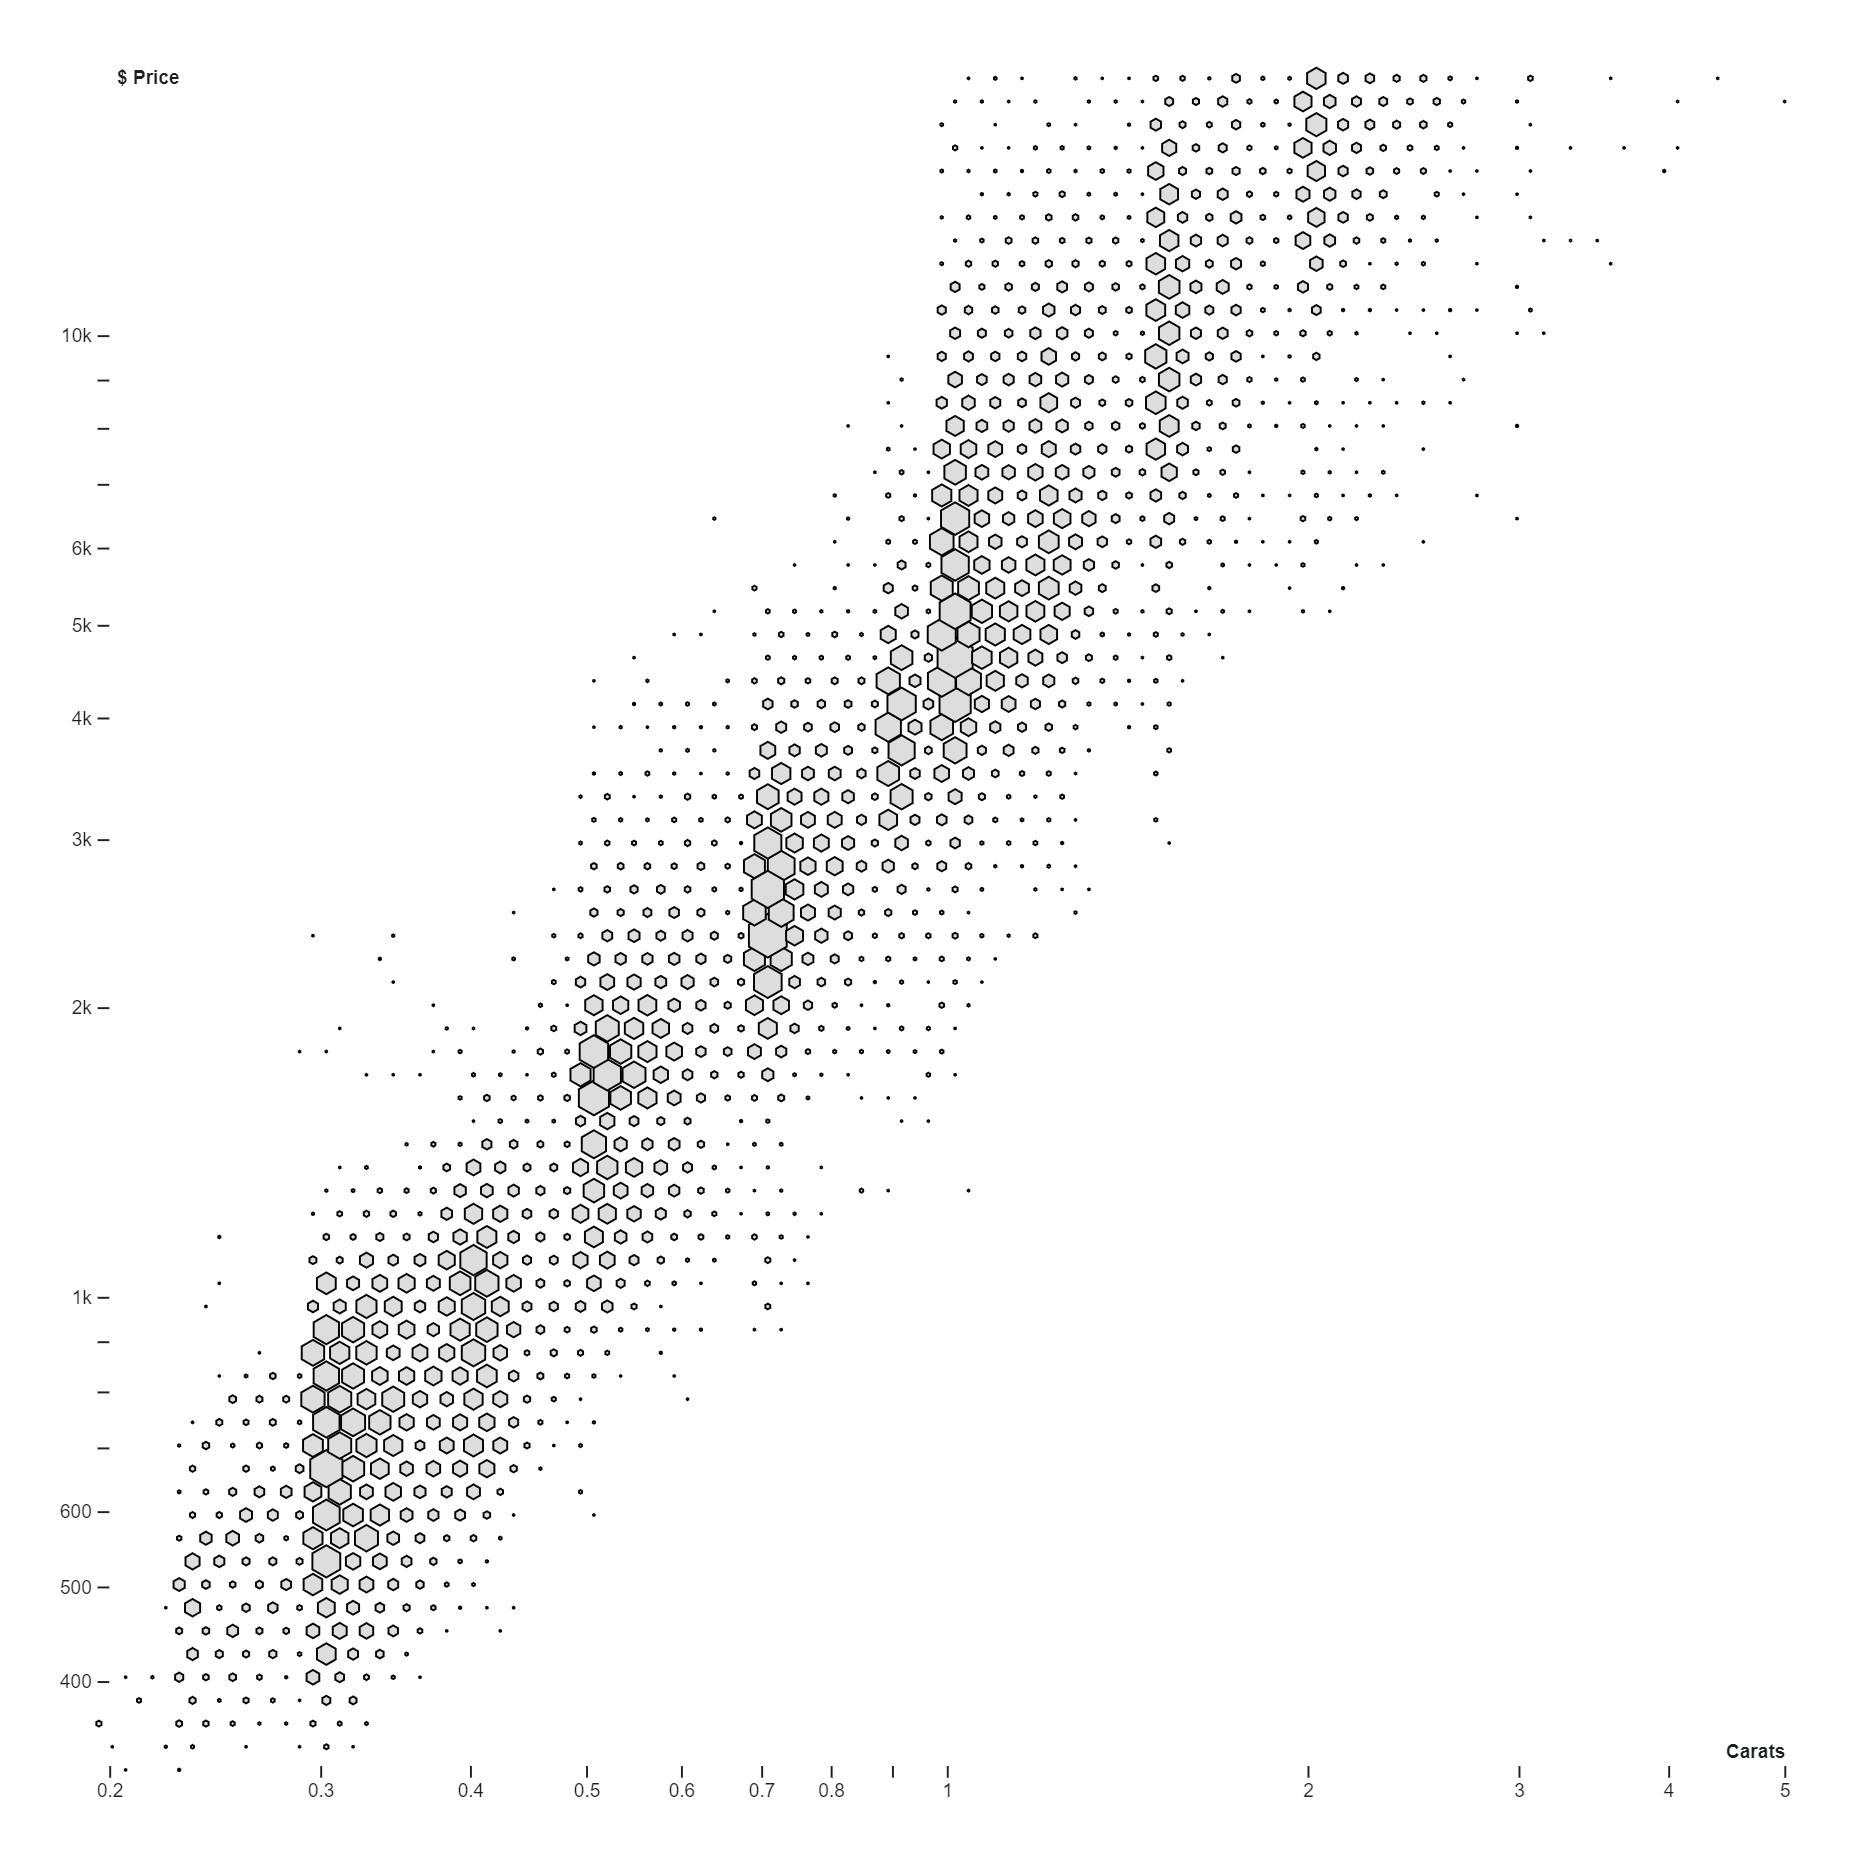
A Hexbin map, also known as a hexagonal binning map, refers to two different concepts. The first concept is based on a geospatial object where all regions of the map are represented as hexagons. This technique is very similar to a choropleth map, except that the geoJson input gives hexagon boundaries instead of region boundaries. The second concept refers to a 2D density technique. In this case, the map area is split into a multitude of hexagons, and the number of data points per hexagon is counted and represented as a color. This is essentially a 2D density technique plotted on top of a map. Hexbin maps have an advantage over usual choropleth maps as each region is represented equally, dismissing the bias introduced by the size of the polygon in choropleth maps. However, the geographical landmarks do not exist in hexbin maps, which can confuse the audience.
Uses:
1. Data Density Visualization: Hexbin maps are excellent for visualizing the density of data points in a geographical area.
2. Spatial Analysis: They can be used for spatial analysis, where issues of connectivity, nearest neighborhood, or movement paths are crucial.
3. Reducing Sampling Bias: Hexbin maps can help reduce sampling bias from edge effects of the grid shape.
4. Large Data Sets: They are particularly useful when dealing with large data sets, as they can effectively represent a high volume of data points.
5. Overlapping Data Points: Hexbin maps can handle overlapping data points better than traditional maps.
6. Equal Representation: Unlike choropleth maps, hexbin maps give equal representation to all regions, dismissing the bias introduced by the size of the polygon.
7. Geospatial Object Representation: Hexbin maps can represent all regions of a map as hexagons.
8. 2D Density Techniques: Hexbin maps can utilize 2D density techniques to represent data.
9. Data Aggregation: They can be used for aggregating and summarizing spatial data.
10. Data Retrieval: Hexbin maps simplify data storage and retrieval for square grids since the coordinates of the vertices of each grid cell are not explicitly stored.
Purposes:
1.Density Visualization:Hexbin maps are effective in visualizing the density of data points within a geographic area. By aggregating data points into hexagonal bins, these maps provide a clear representation of where data concentrations are highest.
2.Handling Overplotting:Hexbin maps help mitigate the issue of overplotting, which occurs when multiple data points overlap, making it difficult to discern individual points. By binning points into hexagons, hexbin maps maintain data integrity while providing a clearer visualization.
3.Smoothing Spatial Data:Hexbin maps can be used to smooth spatial data by aggregating points into hexagonal bins. This helps reduce noise and emphasize broader spatial patterns in the data.
4.Spatial Analysis:Hexbin maps facilitate spatial analysis by allowing users to analyze patterns, trends, and relationships within spatial data sets. They enable the identification of spatial clusters, hotspots, and outliers.
5.Visualizing Spatial Distribution:Hexbin maps provide a visually appealing way to represent the spatial distribution of data. They highlight areas of high and low concentration, making it easier to interpret spatial patterns and trends.
6.Correlation Analysis:Hexbin maps can be used to visualize the relationship between two spatial variables. By binning data points based on both variables, these maps allow users to assess correlation and spatial dependence between them.
7.Identifying Spatial Disparities:Hexbin maps help identify spatial disparities or inequalities by visualizing variations in data distribution across different geographic regions. This is particularly useful in social, economic, and environmental studies.
8.Handling Unevenly Distributed Data:Hexbin maps are suitable for visualizing unevenly distributed data, where some areas may have a higher density of data points than others. By aggregating points into hexagons, these maps provide a balanced representation of spatial data.
9.Heatmapping:Hexbin maps can be used to create heatmaps, where the color intensity of hexagons represents the density or magnitude of a particular variable. This helps highlight areas of interest or significance within a geographic area.
10.Interactive Data Exploration:Hexbin maps support interactive data exploration, allowing users to zoom in, pan, and interactively filter data based on specific criteria. This enables users to delve deeper into spatial patterns and relationships within the data.

Reviews
There are no reviews yet.