Description:
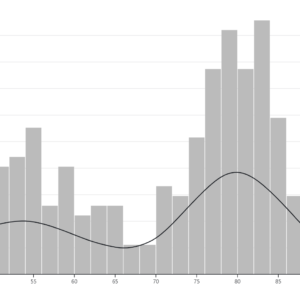
A histogram is a graphical representation of the distribution of numerical data. It consists of a series of vertical bars, each representing a range of values (known as a bin) along the horizontal axis, and the frequency or count of observations falling within each bin along the vertical axis. The height of each bar corresponds to the number of data points or observations within that particular range or bin. Histograms are commonly used in statistics and data analysis to visualize the shape, central tendency, and spread of a dataset. They provide insights into the frequency distribution of data, helping analysts understand patterns, trends, and characteristics within the dataset.
Uses:
- Data Distribution Analysis:Histograms are commonly used to visualize the distribution of data, providing insights into the shape, central tendency, and spread of a dataset.
- Identifying Central Tendency:Histograms help identify the central tendency of a dataset by locating peaks or modes in the distribution, such as mean, median, and mode.
- Detecting Outliers:Outliers, or data points that significantly deviate from the rest of the dataset, can be easily identified on a histogram, aiding in data cleaning and anomaly detection.
- Assessing Skewness and Kurtosis:Histograms assist in assessing the skewness (asymmetry) and kurtosis (peakness) of a distribution, providing valuable insights into the data’s statistical properties.
- Comparing Multiple Distributions:Histograms allow for the comparison of multiple datasets or variables by plotting them on the same graph, facilitating visual comparisons and trend analysis.
- Checking for Normality:Histograms are useful for assessing whether a dataset follows a normal distribution, which is important for many statistical analyses and modeling techniques.
- Exploring Patterns and Trends:Histograms enable analysts to explore patterns and trends in the data, such as seasonality, cycles, or trends over time, aiding in forecasting and decision-making.
- Determining Data Ranges:Histograms help determine the range of values present in a dataset, including the minimum and maximum values, as well as the presence of gaps or clusters within the data.
- Assessing Data Quality:Histograms can reveal data quality issues such as missing values, data entry errors, or incorrect measurement units, facilitating data validation and quality assurance processes.
- Communicating Findings:Histograms are effective tools for communicating findings and insights to stakeholders, as they provide a visual summary of the data distribution in a clear and interpretable format.
Purposes:
- Visualization:Histograms visually represent the distribution of data, making it easier to interpret patterns and trends within the dataset.
- Analysis:Histograms provide a basis for quantitative analysis, allowing researchers and analysts to derive statistical measures and insights from the data distribution.
- Comparison:Histograms facilitate the comparison of data distributions, enabling researchers to identify similarities, differences, and relationships between variables or datasets.
- Detection:Histograms aid in the detection of outliers, anomalies, and data patterns that may require further investigation or intervention.
- Diagnosis:Histograms help diagnose data quality issues, distributional properties, and underlying patterns, supporting informed decision-making and problem-solving.
- Exploration:Histograms enable researchers to explore and understand the structure, characteristics, and behavior of a dataset, uncovering hidden insights and relationships.
- Assessment:Histograms assist in assessing the normality, skewness, kurtosis, and other statistical properties of a dataset, informing the selection of appropriate analytical techniques and models.
- Validation:Histograms validate assumptions and hypotheses about the data distribution, providing evidence to support or refute analytical findings and conclusions.
- Communication:Histograms serve as effective communication tools, conveying complex data distributions and findings to a diverse audience in a clear and understandable manner.
- Decision Support:Histograms provide valuable information for decision-making processes

Reviews
There are no reviews yet.