Description
Description:
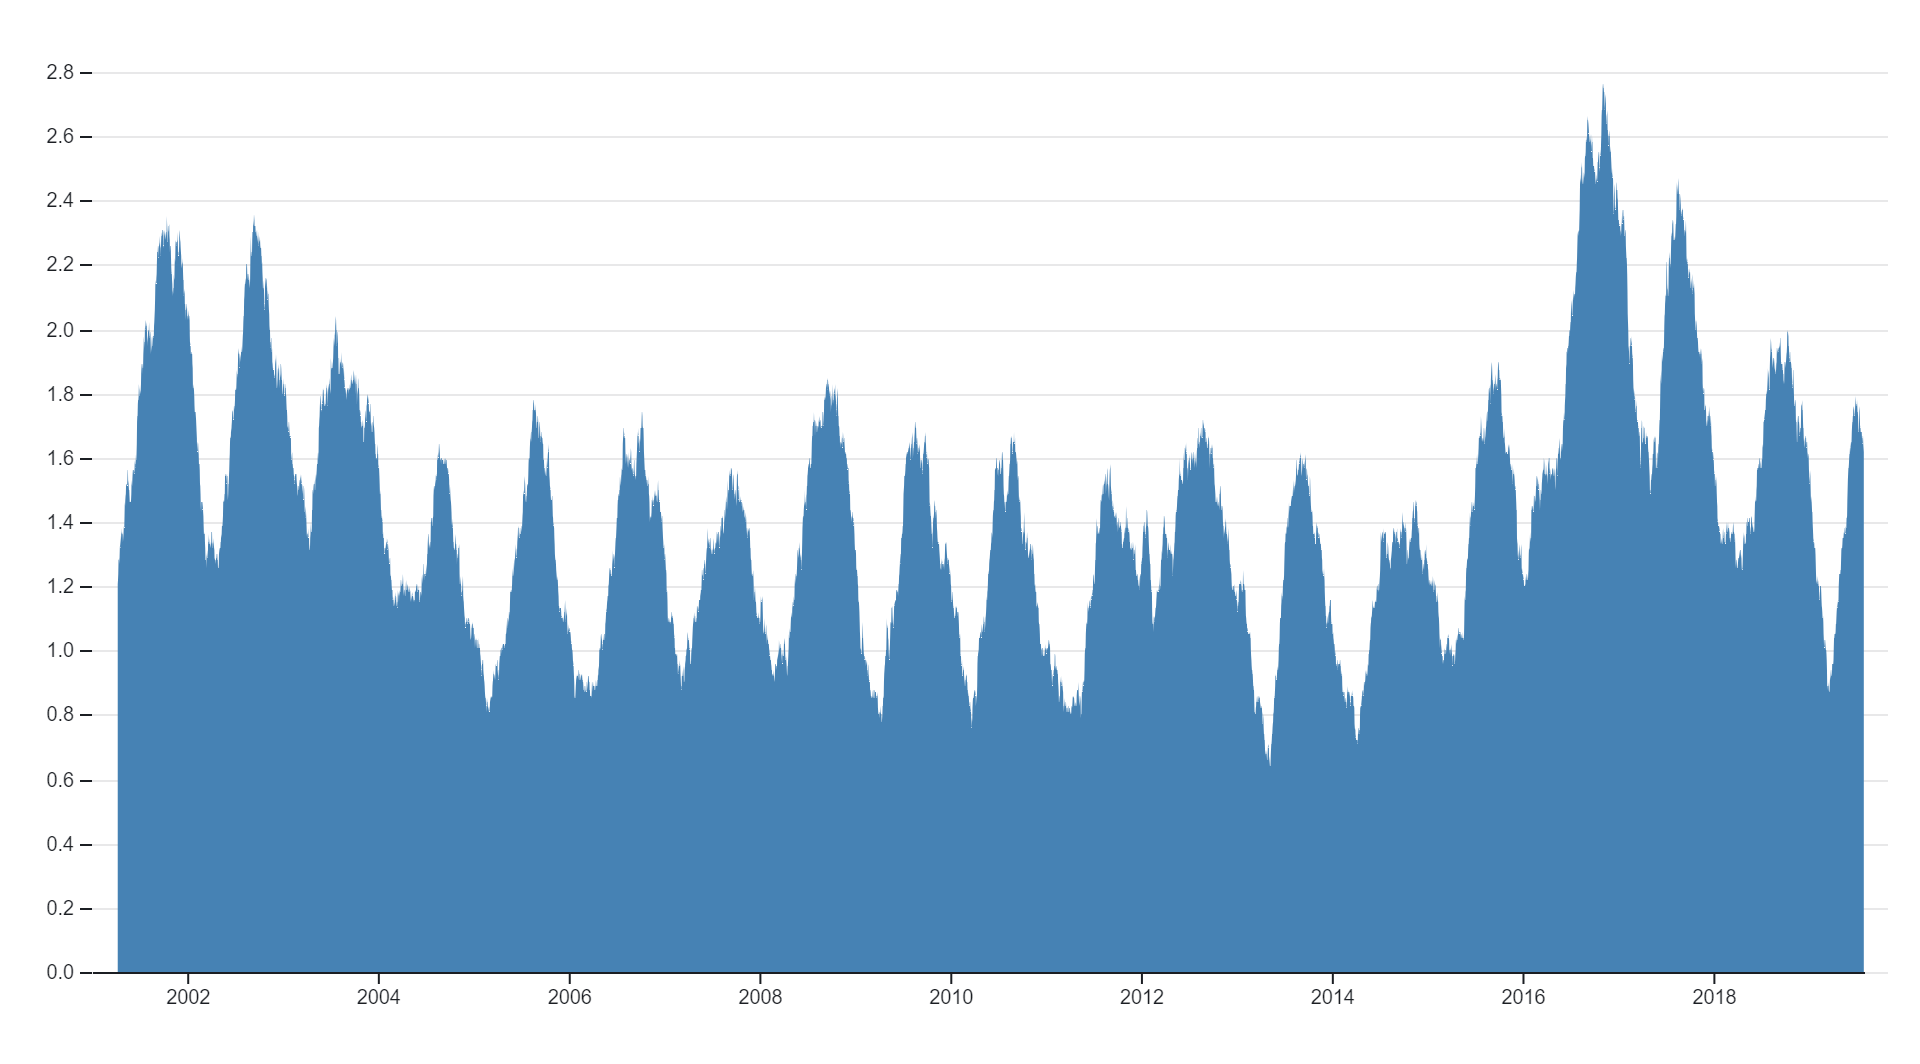
Moving average charts are a fundamental tool in statistical process control, commonly employed to monitor and visualize the stability or trends within a dataset over time. These charts display the average value of a series of data points within successive intervals, with the interval size typically determined based on the specific application and desired level of sensitivity to changes. By smoothing out short-term fluctuations and highlighting underlying trends or patterns, moving average charts enable analysts to identify shifts in the data that may indicate process variability or performance changes. They are widely used across various industries for quality control, financial analysis, and trend forecasting. Additionally, moving average charts often serve as a key component in time series analysis, aiding in the detection of seasonality, cyclic patterns, or long-term trends within the data. Typically, they are accompanied by control limits, allowing practitioners to distinguish between common cause variation (inherent to the process) and special cause variation (indicative of external factors or process changes requiring investigation and potential intervention). Overall, moving average charts provide a simple yet powerful means of monitoring data trends, facilitating informed decision-making and proactive management of processes or systems.
Uses:
1. Trend Identification: Moving average charts are used to smooth out short-term fluctuations in data, making it easier to identify long-term trends.
2. Forecasting: They can be used to generate forecasts by extrapolating the smoothed trend into the future.
3. Signal Filtering: Moving averages filter out noise from the data, making underlying patterns more discernible.
4. Volatility Analysis: In financial markets, moving average charts are used to analyze volatility and assess the stability of price movements.
5. Seasonality Detection: They help in detecting seasonal patterns or cyclic fluctuations within a dataset.
6. Data Compression: Moving averages reduce the amount of data needed to represent trends, making it easier to work with large datasets.
7. Technical Analysis: In stock market analysis, moving average charts are commonly used to identify potential entry and exit points for trades.
8. Smoothing: They provide a smoothed representation of data, making it easier to interpret and analyze.
9. Quality Control: Moving average charts are used in quality control processes to monitor process stability and detect shifts or trends in product quality.
10. Economic Analysis: In economics, moving average charts are used to analyze economic indicators such as unemployment rates, GDP growth, or inflation trends.
Purposes:
1. Process Monitoring: Moving average charts are used to monitor processes over time, detecting any deviations from expected behavior.
2. Pattern Recognition: They help in recognizing patterns such as seasonality, trends, or cycles within the data.
3. Noise Reduction: Moving averages filter out random fluctuations or noise, highlighting underlying trends or patterns.
4. Decision Making:They assist in making informed decisions by providing a clearer picture of the data’s behavior over time.
5. Risk Management: Moving average charts are used in risk management to identify potential risks or changes in market conditions.
6. Benchmarking: They provide a baseline for comparing current performance against historical averages or benchmarks.
7. Process Improvement: By monitoring process performance, moving average charts help in identifying areas for improvement or optimization.
8. Resource Allocation: They assist in allocating resources effectively by identifying areas of high or low performance.
9. Early Warning System: Moving average charts serve as an early warning system, alerting stakeholders to potential issues or changes in data patterns.
10. Communication: They facilitate communication by providing a visual representation of data trends, making it easier to convey complex information to stakeholders.
Only logged in customers who have purchased this product may leave a review.
Related products
-
- Sale!
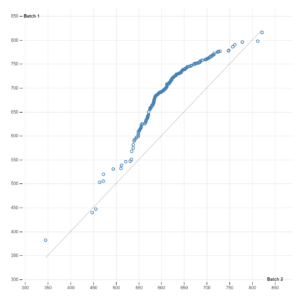
Q-Q Plot
- Original price was: $ 15.$ 10Current price is: $ 10.
- Add to cart
-
- Sale!
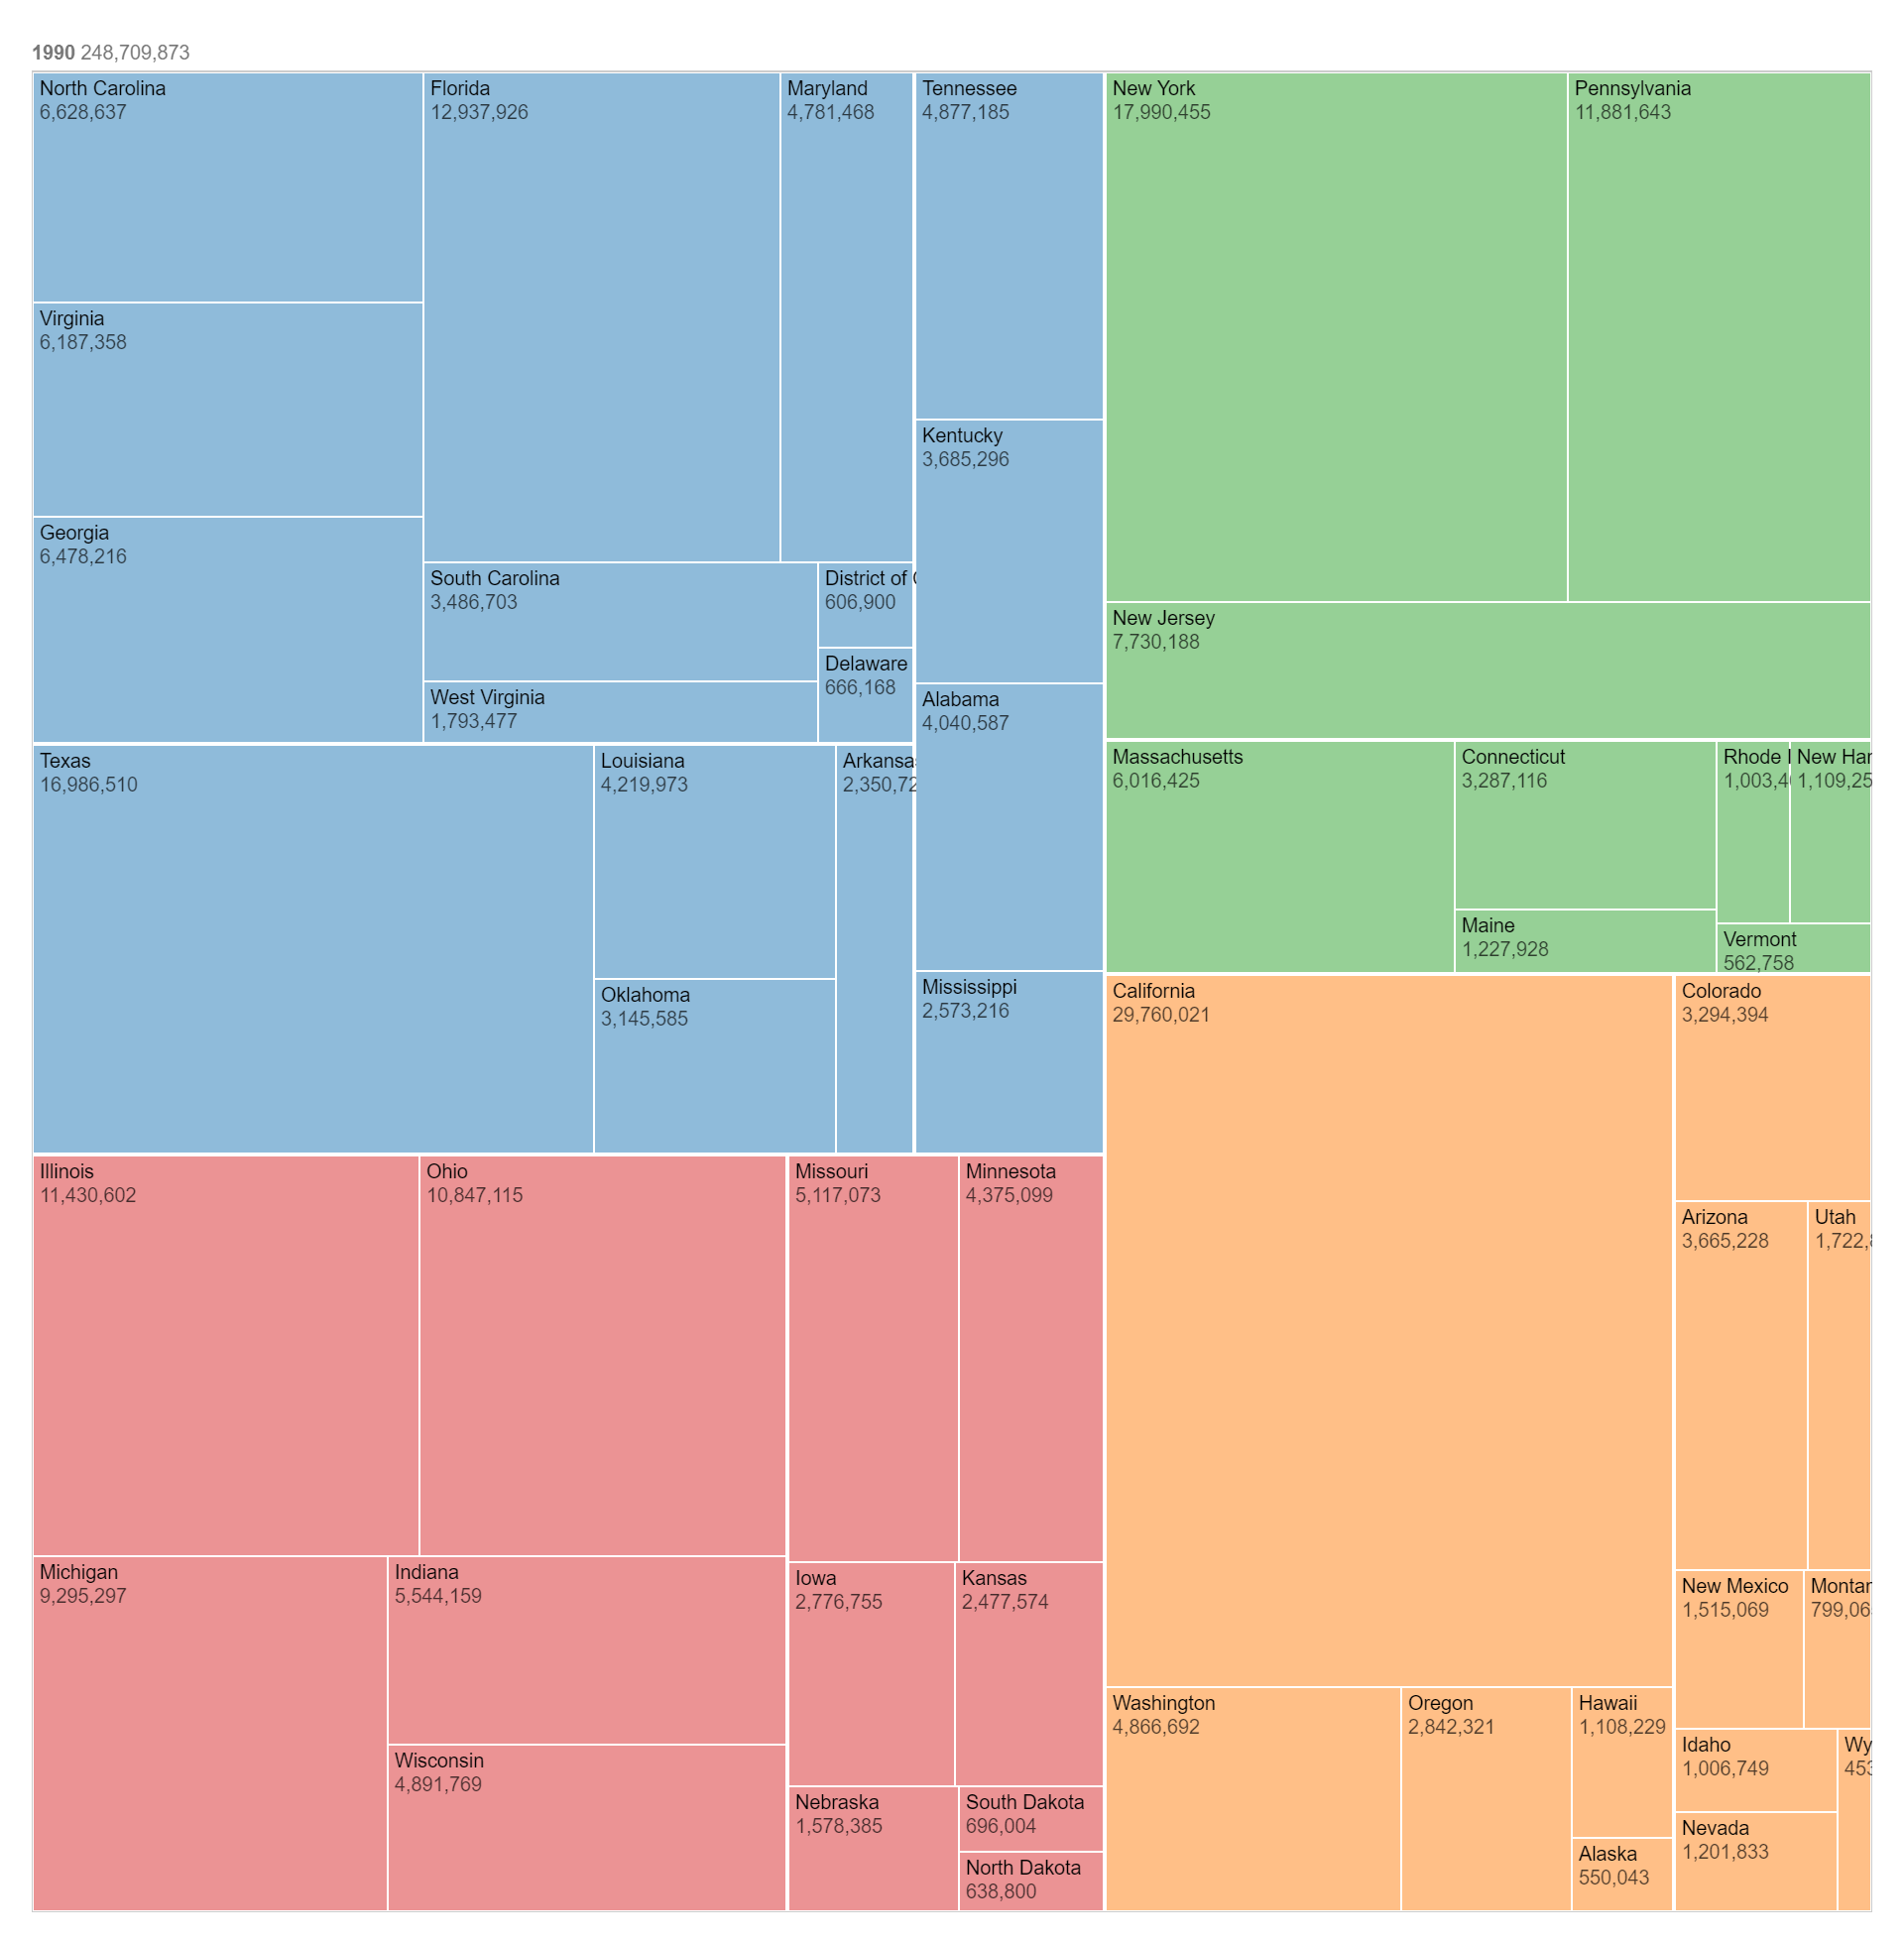
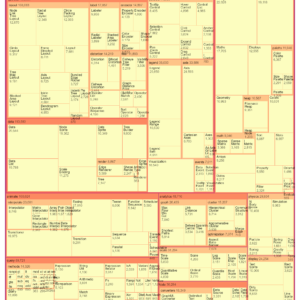
Nested Tree Map
- Original price was: $ 15.$ 10Current price is: $ 10.
- Add to cart
-
- Sale!
Normal Quantile Plot
- Original price was: $ 15.$ 10Current price is: $ 10.
- Add to cart
Reviews
There are no reviews yet.