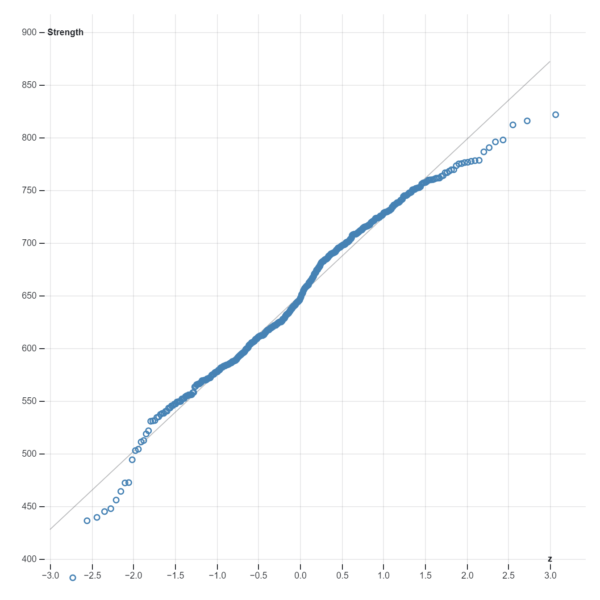
A normal quantile plot, also known as a Q-Q (quantile-quantile) plot, is a graphical technique used to assess whether a dataset follows a normal distribution or any other specified distribution. It compares the observed quantiles of the dataset against the quantiles of a theoretical normal distribution.In a normal quantile plot, the x-axis represents the theoretical quantiles from the standard normal distribution (or any other specified distribution), while the y-axis represents the quantiles of the dataset being analyzed. Each data point on the plot corresponds to a pair of values: the observed value from the dataset and its corresponding expected value from the theoretical distribution.If the dataset follows a normal distribution, the points on the plot will fall approximately along a straight line. Deviations from this straight line suggest departures from normality. For instance, if the points curve upward or downward, it indicates that the data has heavier tails or is more peaked than a normal distribution.Normal quantile plots are particularly useful for assessing normality assumptions in statistical analyses and for identifying outliers or data points that do not conform to the assumed distribution. They provide a visual means of checking the validity of distributional assumptions, aiding in the interpretation and validation of statistical models and results.
Uses:
Normality Assessment: A normal quantile plot is primarily used to visually assess whether a dataset follows a normal distribution.
Outlier Detection: It helps in identifying outliers or extreme values that do not conform to the expected distribution.
Model Validation: Normal quantile plots are used to validate statistical models that assume a normal distribution for the data.
Data Transformation: They assist in determining the need for data transformation to achieve normality, which is often required for certain statistical analyses.
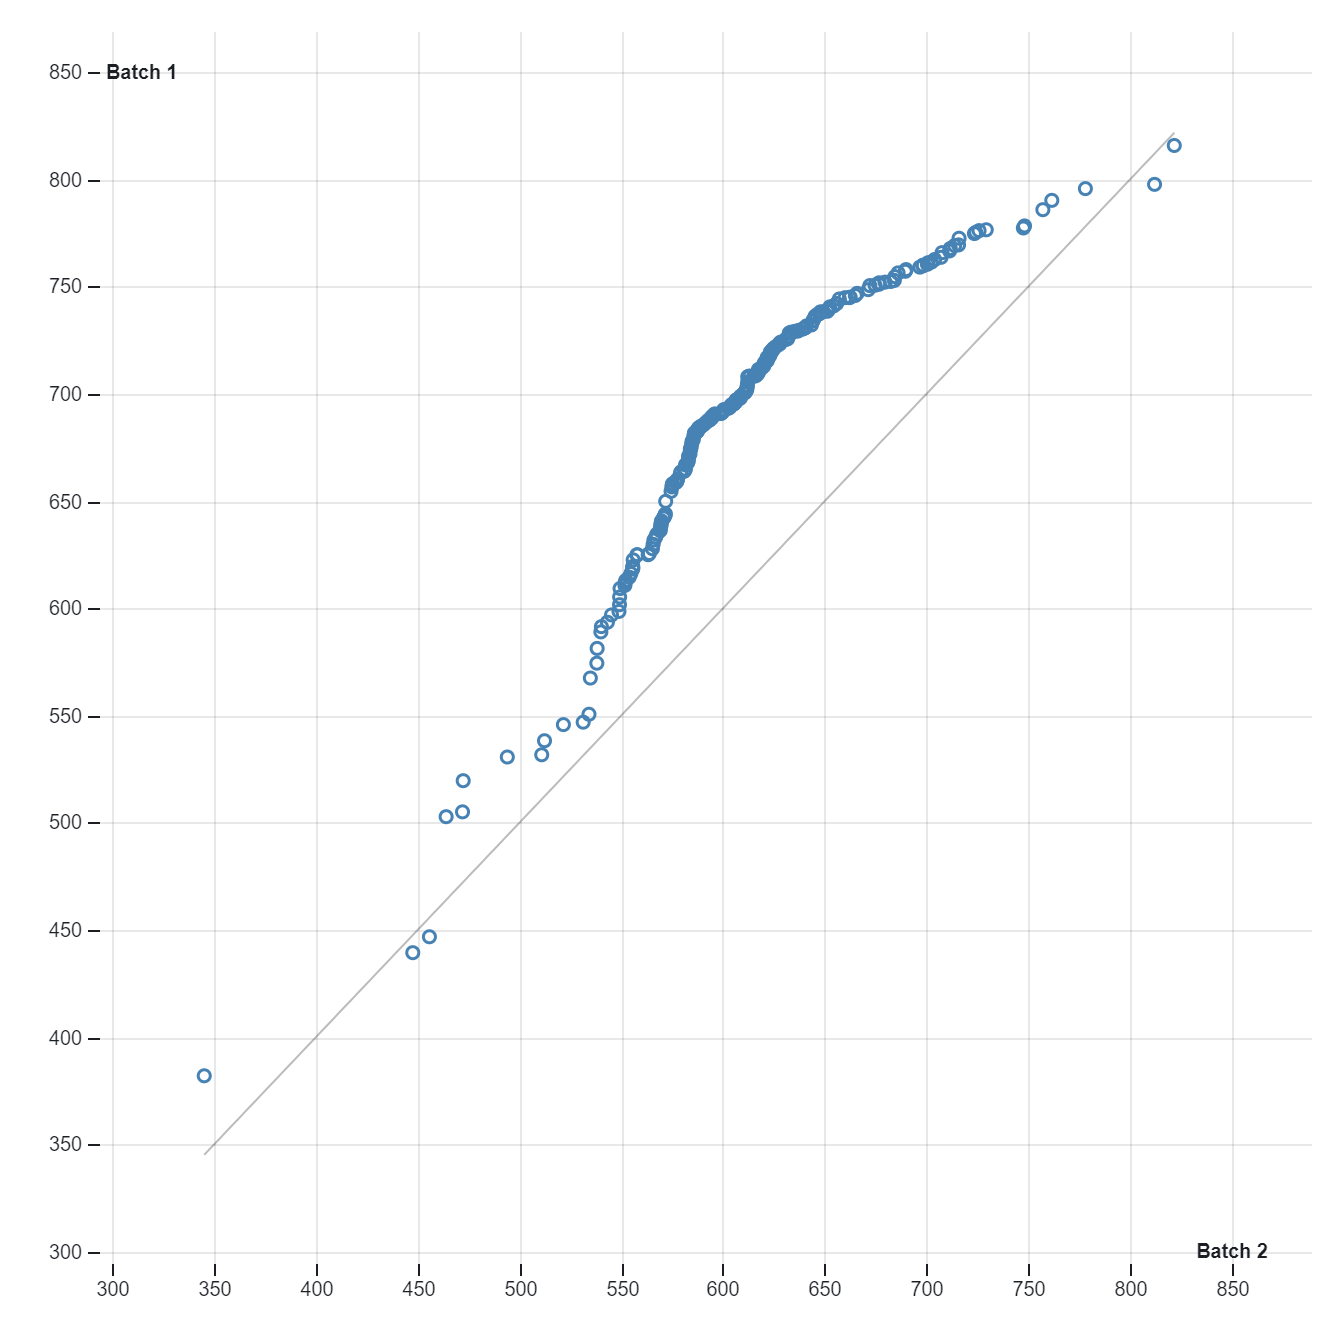
Comparison of Distributions: Normal quantile plots facilitate the comparison of different datasets or subsets to assess their similarity in terms of distributional shape.
Quality Control: They are employed in quality control processes to verify if process data conform to normal distribution assumptions.
Assumption Checking: Normal quantile plots are used in various statistical analyses to check the assumption of normality, such as in hypothesis testing or regression analysis.
Variable Selection: In regression analysis, normal quantile plots aid in selecting variables by assessing their distributional characteristics.
Robustness Testing: They help in testing the robustness of statistical methods to deviations from normality assumptions.
Data Exploration: Normal quantile plots serve as an exploratory tool to gain insights into the distributional characteristics of the data.
Purpose:
Diagnostic Tool: Normal quantile plots serve as a diagnostic tool to evaluate the goodness-of-fit of a dataset to a normal distribution.
Assumption Verification: They verify the assumption of normality, which is crucial for many statistical methods and analyses.
Visualization: Normal quantile plots provide a visual representation of the data distribution, aiding in interpretation and communication of results.
Decision Making: They assist in decision making by providing insights into the distributional properties of the data and the validity of statistical analyses.
Anomaly Detection: Normal quantile plots help in detecting anomalies or data points that deviate significantly from the expected distribution.
Distributional Comparison: They facilitate the comparison of observed distributions with theoretical distributions or with each other.
Quality Assurance: Normal quantile plots are used in quality assurance processes to ensure data quality and adherence to distributional assumptions.
Data Preprocessing: They guide data preprocessing steps by identifying the need for transformation or outlier removal.
Educational Tool: Normal quantile plots serve as an educational tool for understanding distributional concepts and statistical methods.
Validation: They validate the assumptions underlying statistical analyses, ensuring the reliability and validity of research findings.
Reviews
There are no reviews yet.
Only logged in customers who have purchased this product may leave a review.

Reviews
There are no reviews yet.