Description
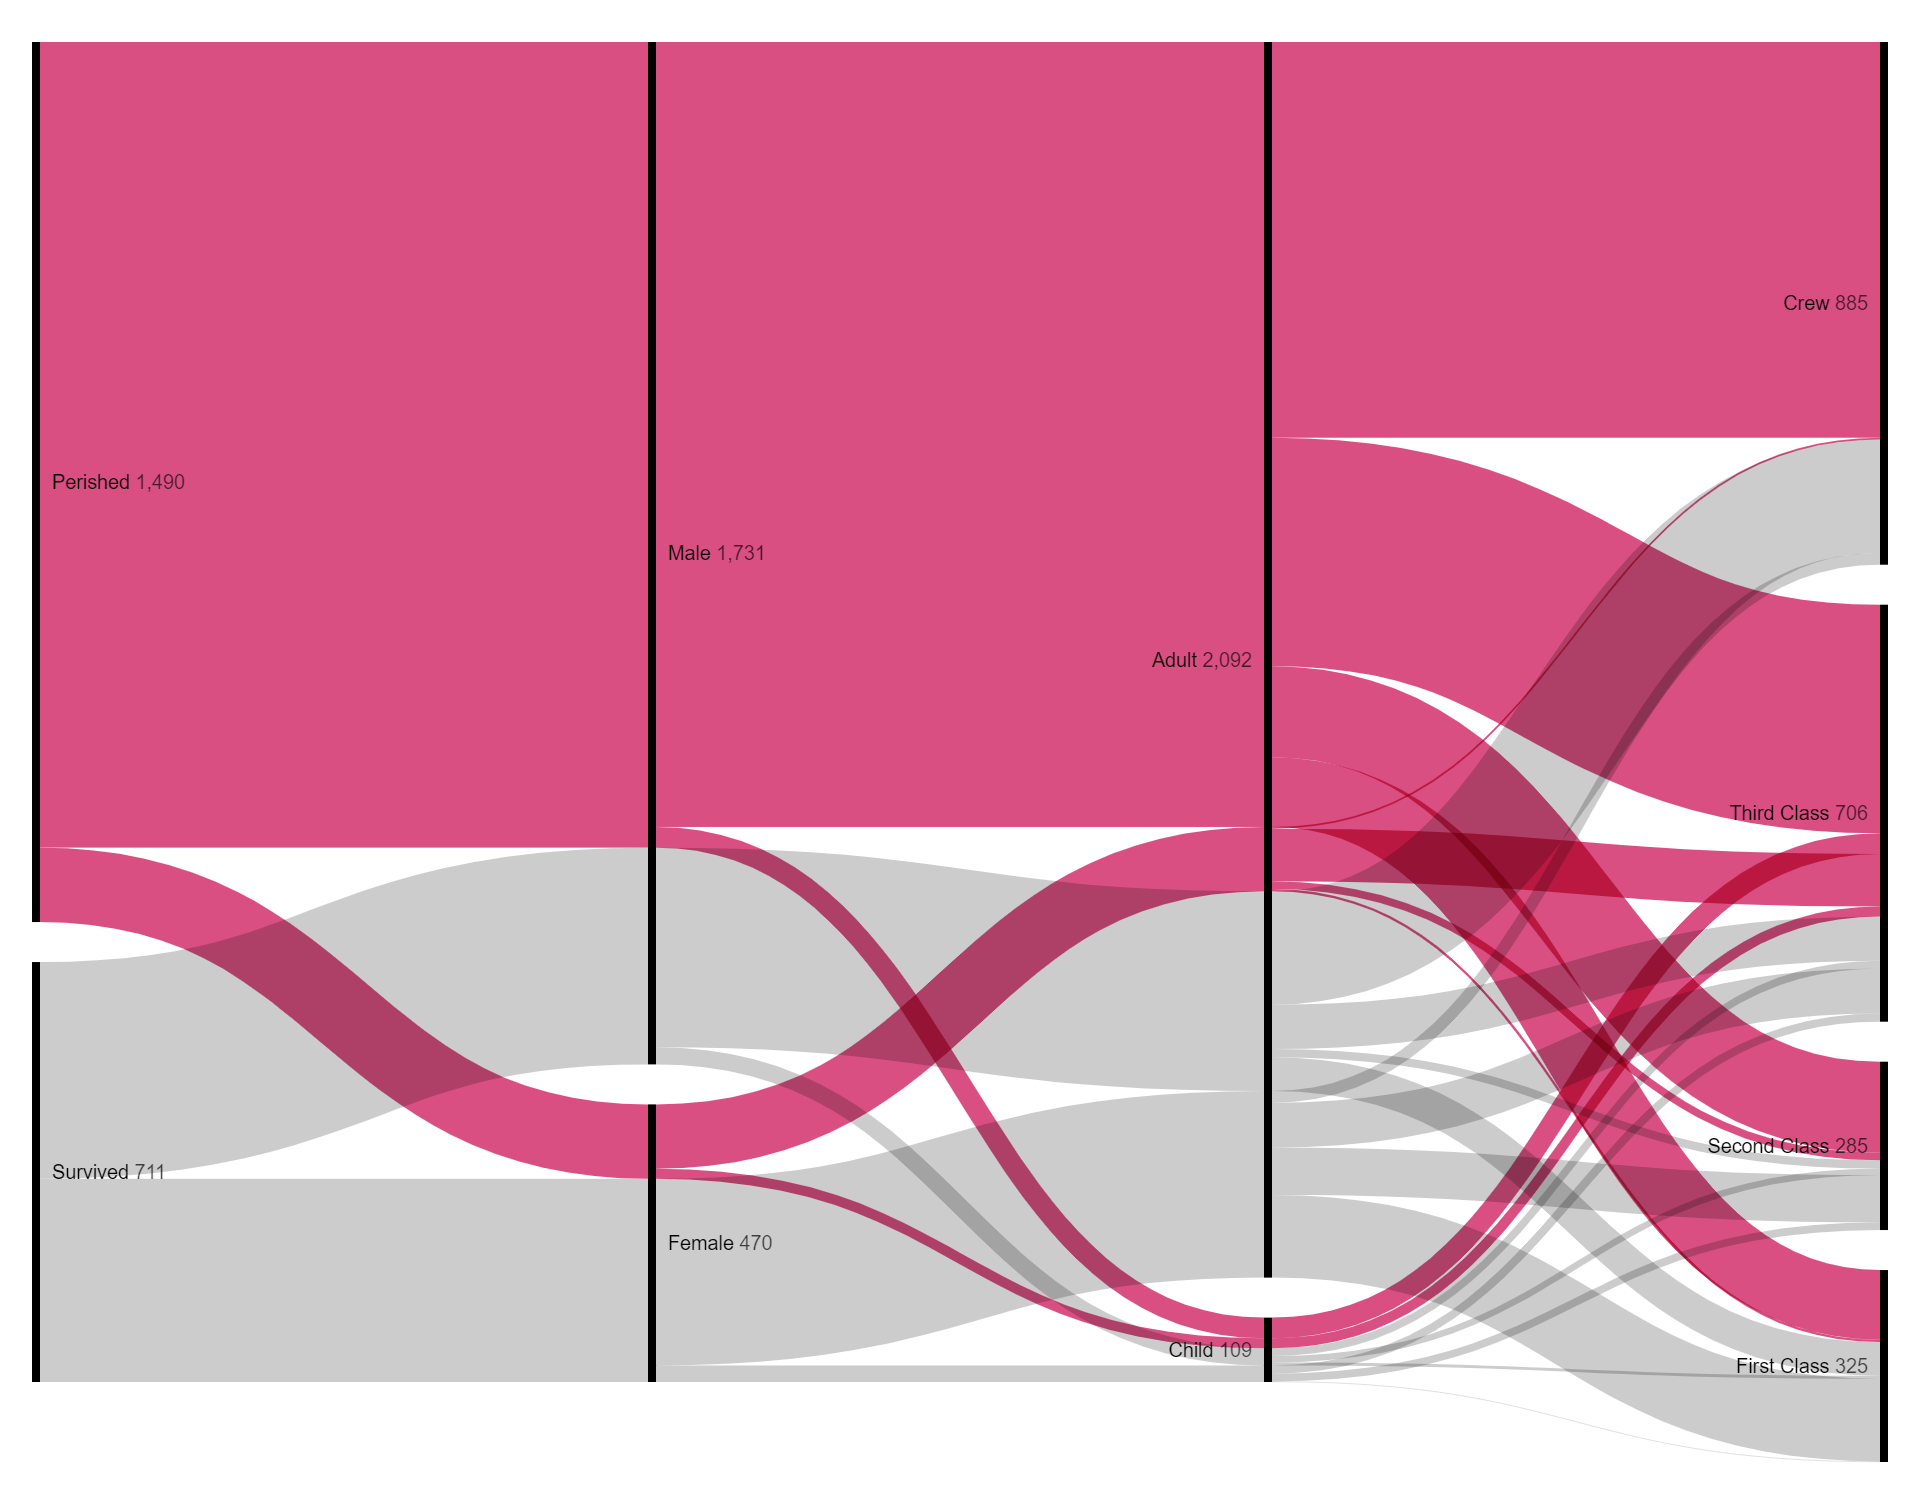
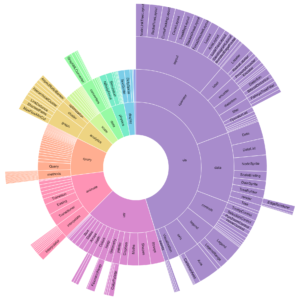
A parallel sets chart, also known as parallel coordinates plot or parallel coordinates chart, is a data visualization technique used to explore the relationships and patterns within multidimensional categorical or numerical datasets. In a parallel sets chart, each dimension or categorical variable is represented by a vertical axis, and each data point is represented by a line that connects points across these axes.The position of a line on each axis corresponds to the value of the variable being represented. Therefore, patterns and relationships between variables can be observed by examining the intersections and connections between the lines across the axes.Parallel sets charts are particularly useful for visualizing complex datasets with multiple dimensions or categorical attributes. They can reveal correlations, clusters, trends, and outliers within the data that might not be apparent in traditional scatter plots or bar charts. Additionally, parallel sets charts facilitate the comparison of different groups or categories within the dataset, making it easier to identify similarities and differences across various attributes.These charts are widely used in fields such as data analysis, exploratory data visualization, machine learning, and pattern recognition. They provide an intuitive and interactive way to gain insights into multidimensional datasets, aiding in decision-making, problem-solving, and hypothesis generation. However, interpretation of parallel sets charts may require some familiarity with the dataset and understanding of the relationships between variables being depicted.
Uses:
1. Multidimensional Data Visualization:Parallel sets charts are used to visualize multidimensional datasets where each data point has multiple attributes or dimensions.
2. Pattern Recognition: They help in identifying patterns, trends, and relationships between different variables within the dataset.
3. Cluster Analysis: Parallel sets charts can aid in cluster analysis by revealing clusters or groups of data points with similar characteristics.
4. Categorical Data Analysis: They are useful for analyzing categorical data by visualizing the relationships between categorical variables.
5. Comparative Analysis: Parallel sets charts facilitate the comparison of different groups, categories, or subsets within the dataset.
6. Outlier Detection: They assist in identifying outliers or data points that deviate significantly from the overall patterns within the dataset.
7. Correlation Analysis: Parallel sets charts help in exploring correlations and dependencies between variables by examining how they vary together.
8. Data Exploration: They serve as an exploratory tool for gaining insights into the structure and characteristics of complex datasets.
9. Interactive Visualization: Parallel sets charts can be interactive, allowing users to explore the data dynamically by filtering, sorting, or highlighting specific categories or patterns.
10. Communication:They are used for communicating insights and findings from multidimensional datasets to stakeholders or audiences in a visually engaging manner.
Purposes:
1. Insight Generation: Parallel sets charts are used to generate insights and hypotheses about the relationships between variables within the dataset.
2. Decision Support: They aid in decision-making by providing a visual representation of complex data patterns, which can inform strategic decisions or actions.
3. Problem-Solving: Parallel sets charts help in problem-solving by visualizing the structure of the data and identifying potential solutions or strategies.
4. Exploratory Data Analysis: They facilitate exploratory data analysis by allowing analysts to interactively explore the dataset and discover hidden patterns or trends.
5. Validation: Parallel sets charts can be used to validate hypotheses or models by visually comparing the observed patterns with expected outcomes.
6. Data Mining: They assist in data mining tasks by visualizing patterns and relationships that can be leveraged for predictive modeling or classification.
7. Data Quality Assessment:Parallel sets charts help in assessing the quality of data by identifying inconsistencies, outliers, or missing values across different dimensions.
8. Feature Selection: They aid in feature selection for machine learning or predictive modeling tasks by identifying the most informative variables.
9. Presentation of Findings: Parallel sets charts are used for presenting findings and insights from complex datasets in reports, presentations, or publications.
10. Explaining Complex Data: They are used to explain complex data structures and relationships to stakeholders or non-technical audiences in a clear and understandable manner.
Only logged in customers who have purchased this product may leave a review.

Reviews
There are no reviews yet.