Description
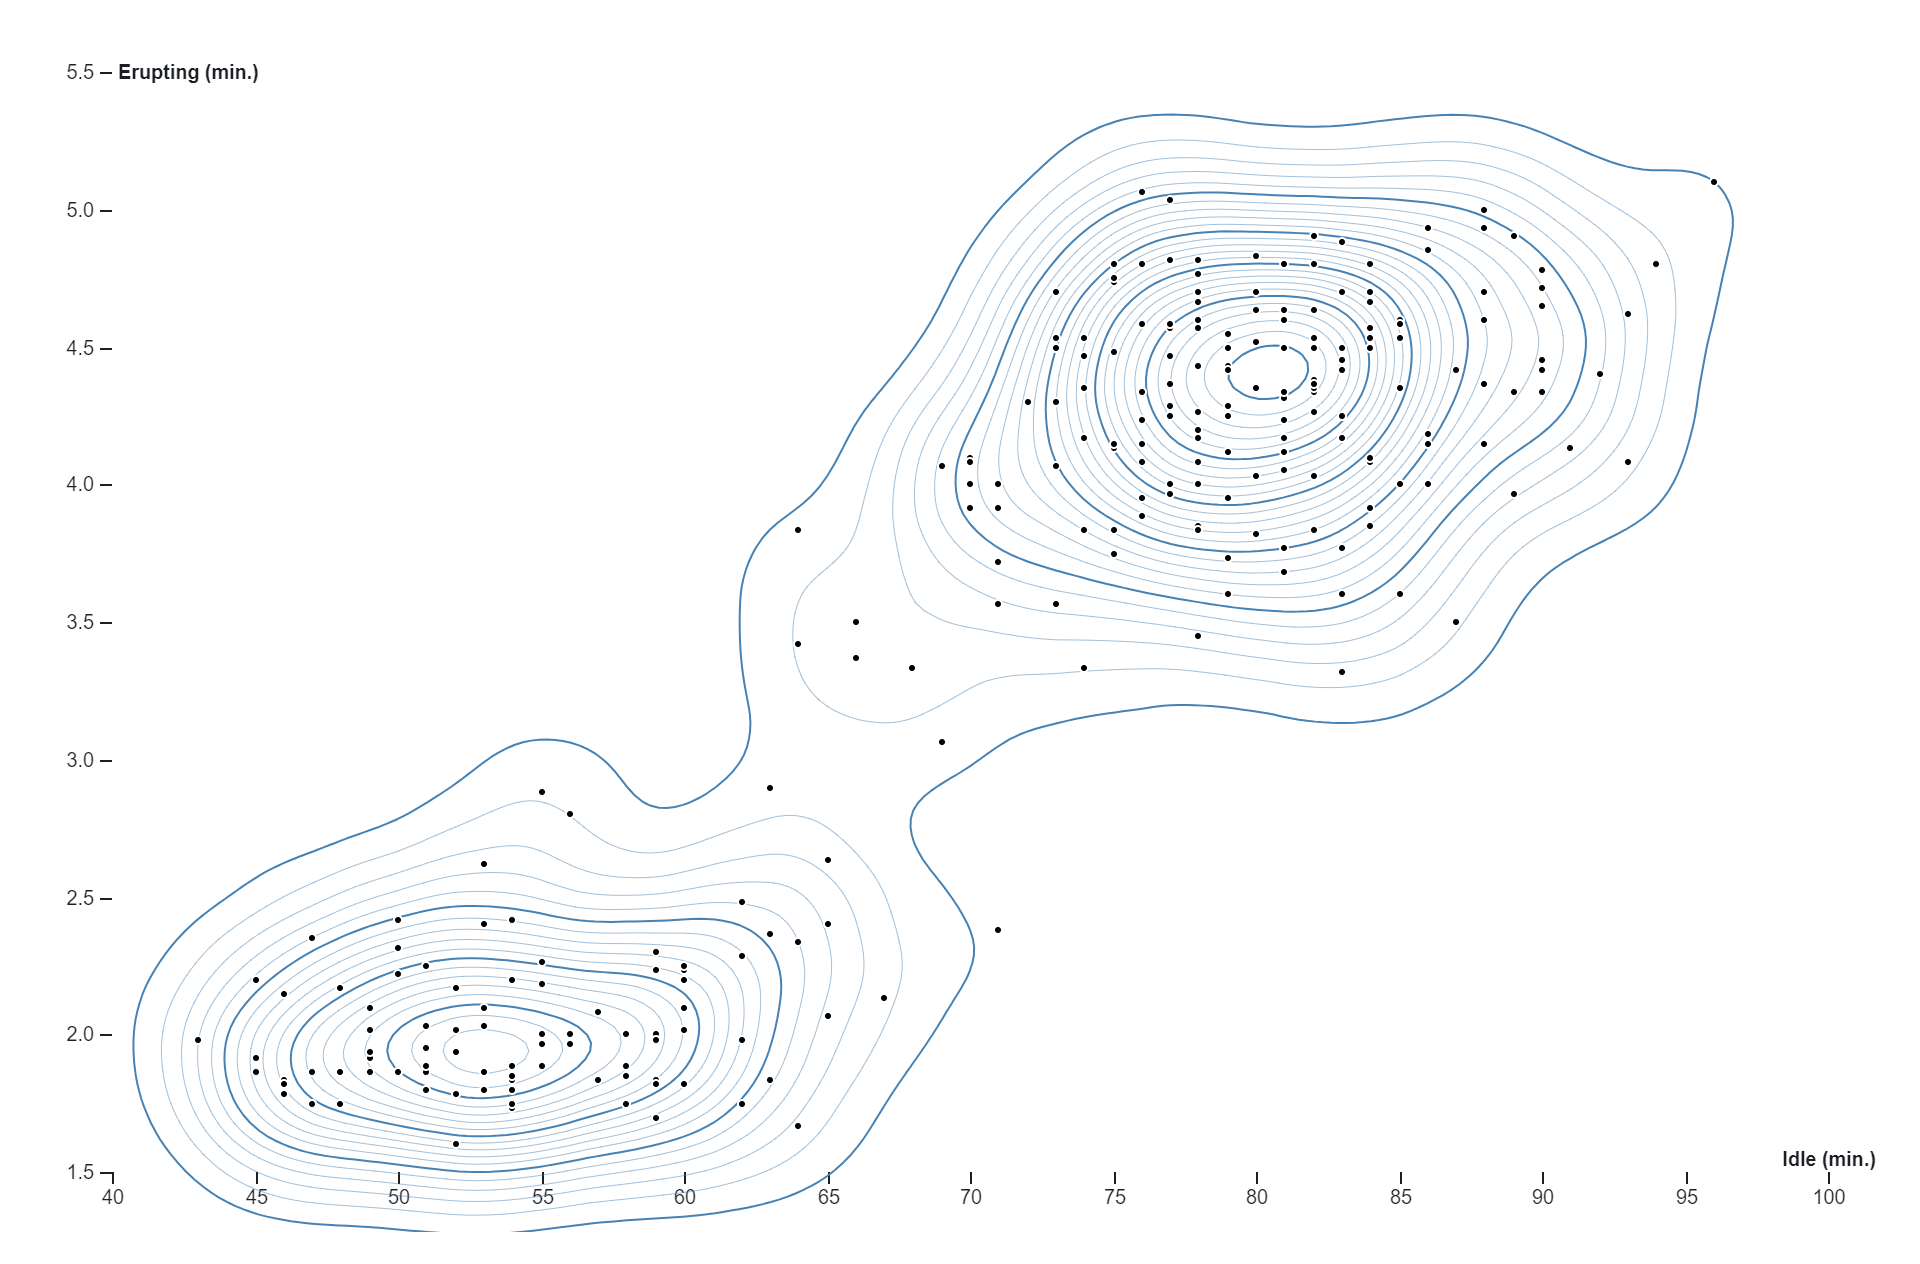
Volcano plots, commonly used in bioinformatics and genomics, are a type of scatter plot designed to visualize the results of statistical tests comparing two conditions (such as control vs. treatment) for each feature in a dataset, often genes or proteins. In a volcano plot, the log2 fold change (or some other measure of effect size) between the two conditions is plotted on the x-axis, while the negative logarithm (base 10) of the p-value resulting from a statistical test (usually a t-test or a similar test) is plotted on the y-axis.The plot is named for its characteristic shape, where the points resembling a volcano illustrate features that are both statistically significant (highly deregulated) and have a large fold change. Thus, the most interesting features are those located in the upper-right or upper-left corners of the plot, often referred to as “upregulated” and “downregulated” genes or proteins, respectively.Volcano plots are valuable for quickly identifying biologically significant changes between conditions, as they enable researchers to simultaneously assess both the magnitude of change and the statistical significance of that change. Features that are far away from the center of the plot, with high significance and large fold change, are typically of the greatest interest and may warrant further investigation as potential targets for subsequent experiments or functional analysis.
Uses:
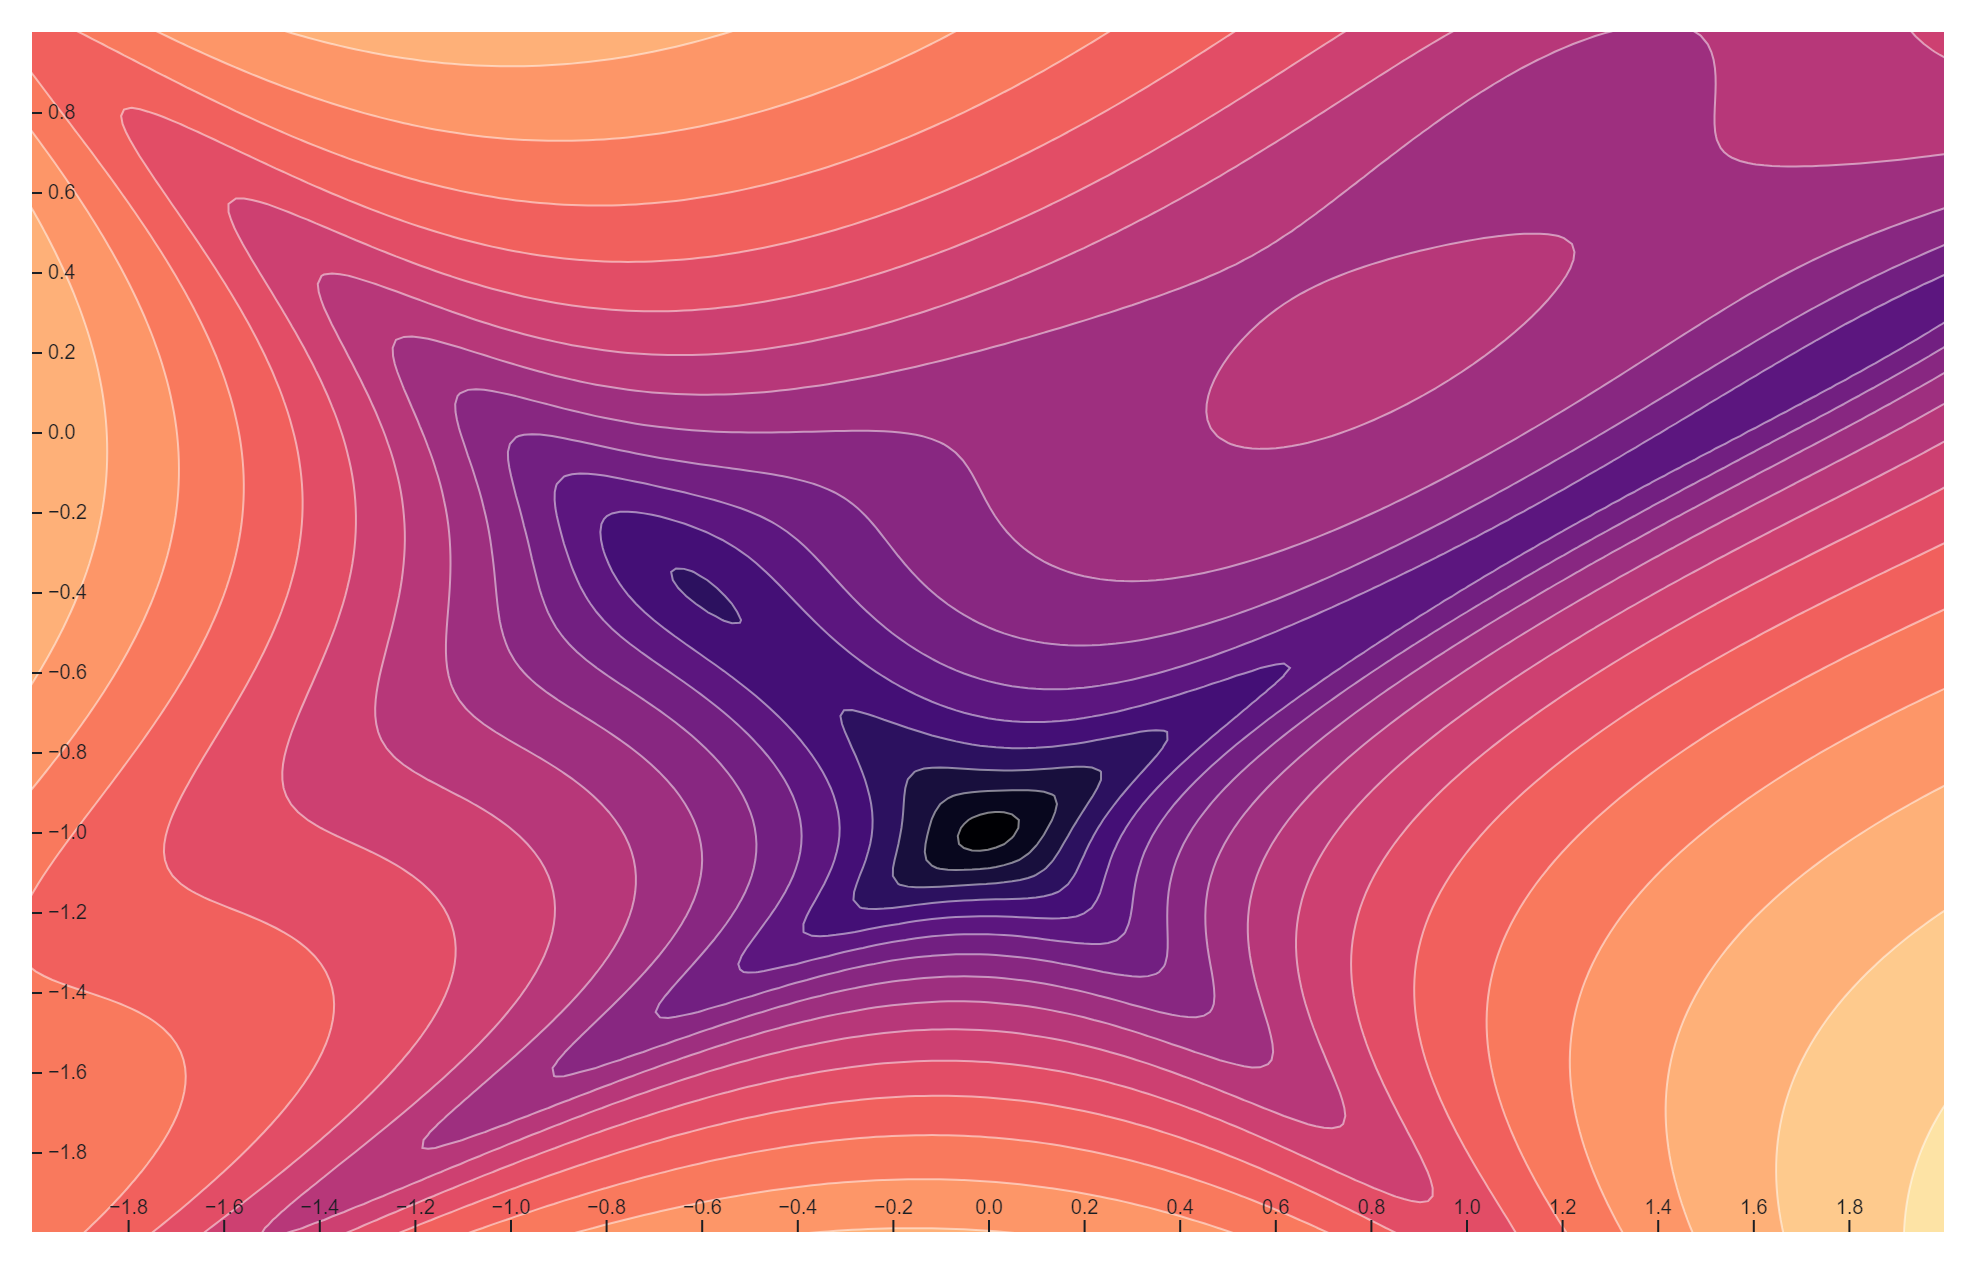
- Visualizing Significance Levels: Contours within a volcano plot can represent significance levels, visually highlighting regions of statistical significance.
- Identifying Thresholds: They can be used to delineate thresholds for statistical significance, aiding in the interpretation of results.
- Differentiating Significance Levels: Contours can distinguish between different levels of significance, helping researchers prioritize features for further investigation.
- Enhancing Interpretability: By overlaying contours, volcano plots become more interpretable, allowing for easier identification of significant features.
- Facilitating Data Exploration: Contours provide a structured way to explore the data, guiding the eye towards regions of interest.
- Comparing Multiple Conditions: Contours can be used to compare significance levels across multiple conditions or experimental groups simultaneously.
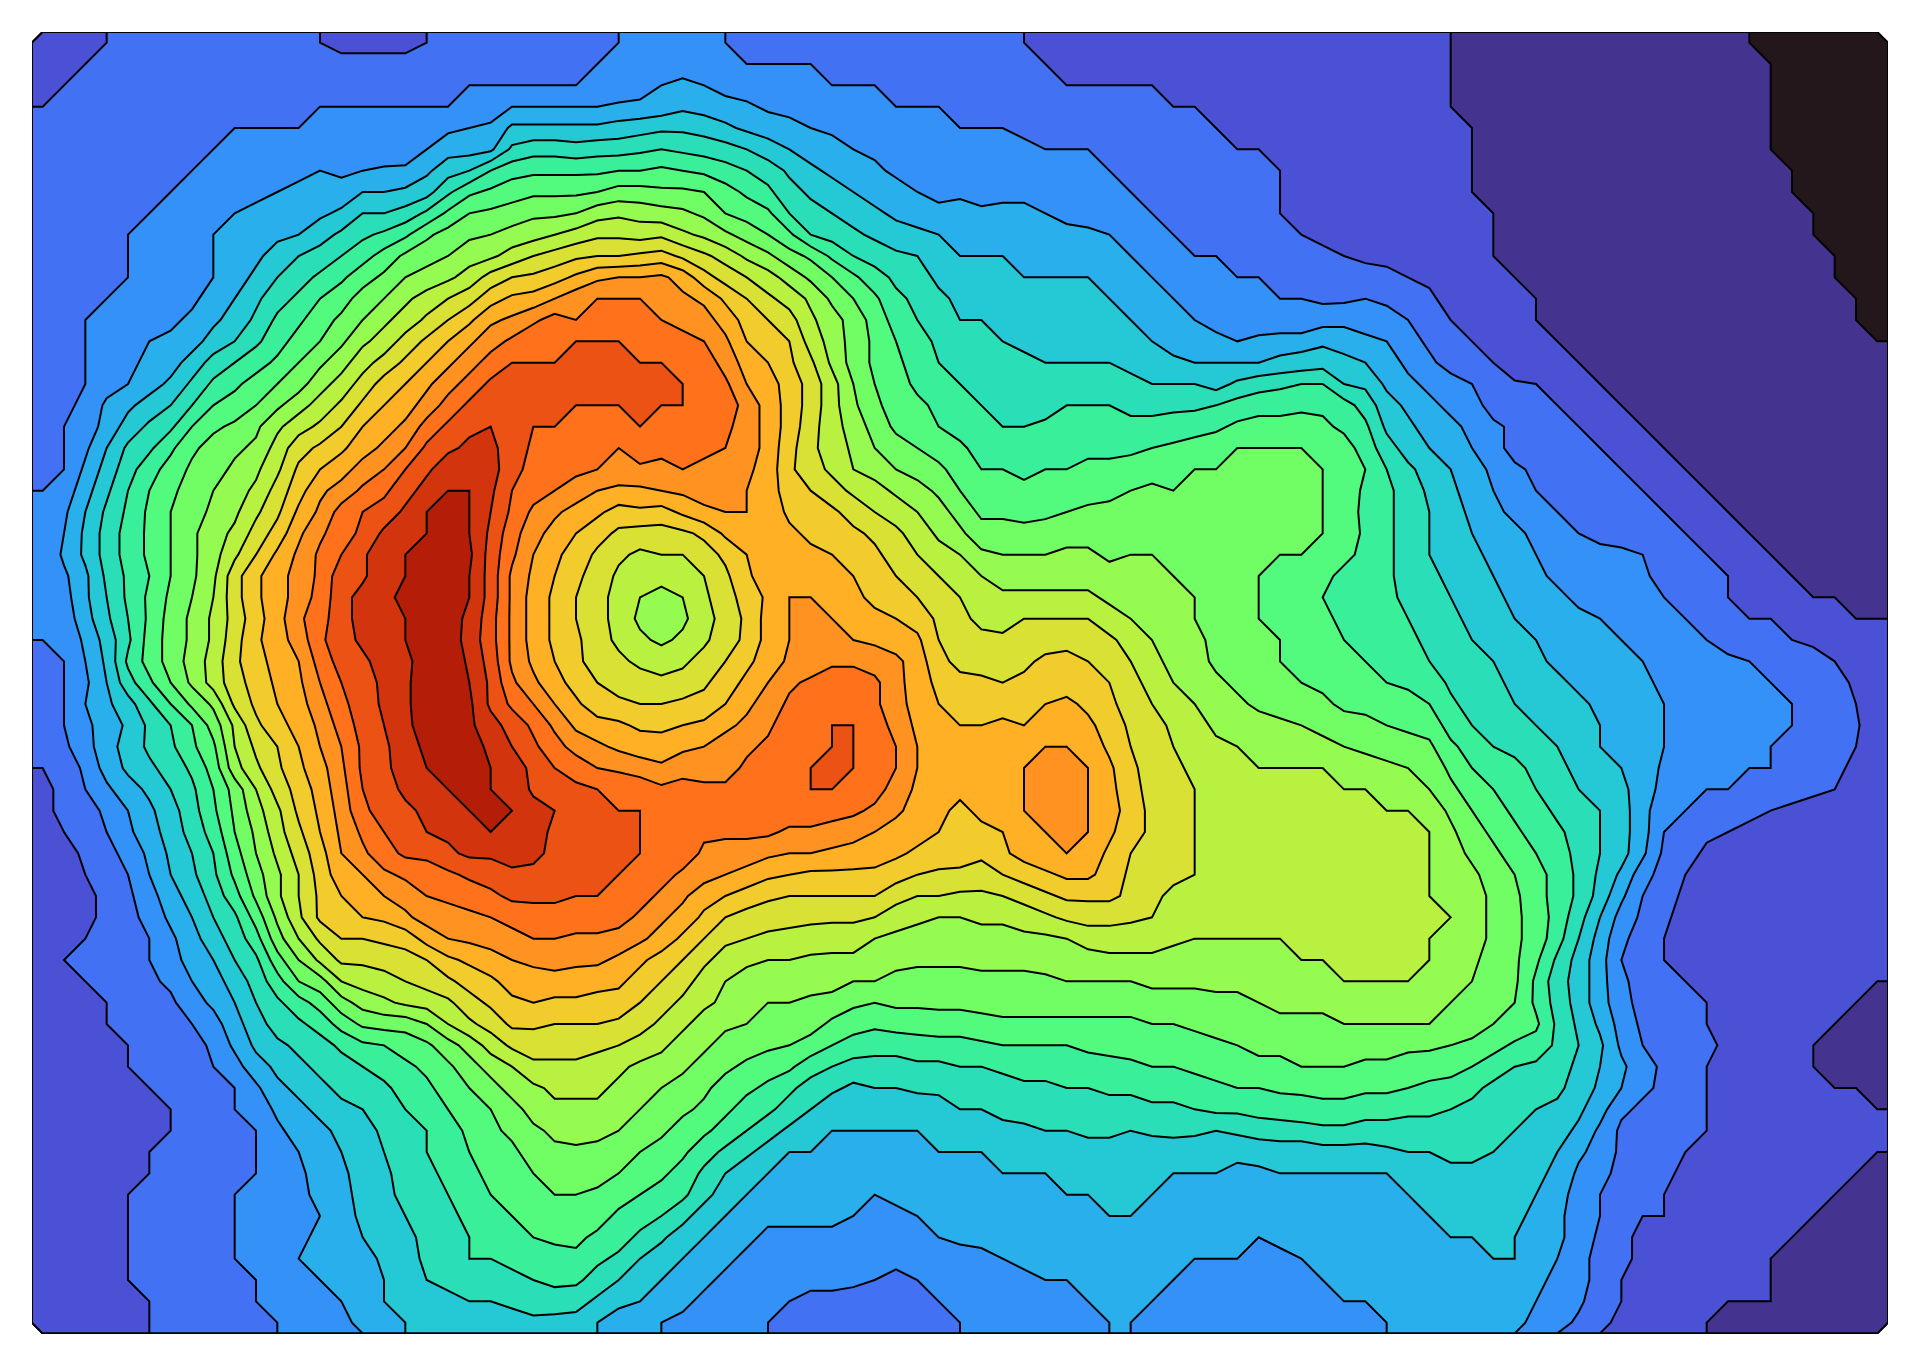
- Highlighting Regions of Interest: They help in identifying specific regions with high significance or large effect sizes, which may warrant further investigation.
- Enhancing Presentation: Contours add visual appeal to volcano plots, making them more engaging and informative for presentations or publications.
- Quality Control: Contours can aid in quality control by visually inspecting the distribution of significant features and assessing the reliability of results.
- Pattern Recognition: They facilitate pattern recognition by revealing spatial clusters or trends in the distribution of significant features within the plot.
Purposes:
- Statistical Analysis: Volcano contours serve as a tool for statistical analysis, providing a visual representation of significance levels across the dataset.
- Hypothesis Testing: They aid in hypothesis testing by visually assessing the significance of differences between conditions or treatments.
- Feature Selection: Contours assist in feature selection by identifying statistically significant features for further analysis or modeling.
- Biological Interpretation: They aid in the biological interpretation of results by highlighting biologically relevant features that exhibit significant changes.
- Validation: Contours help in validating statistical models or hypotheses by visually inspecting the distribution of significance levels.
- Data Mining: They facilitate data mining tasks by guiding researchers towards regions of interest within the dataset.
- Publication: Volcano plots with contours are commonly used in scientific publications to communicate research findings effectively.
- Exploratory Data Analysis: Contours aid in exploratory data analysis by providing insights into the distribution of significance levels and effect sizes.
- Prioritization: They assist in prioritizing features for further experimental validation or functional analysis based on their significance levels.
- Quantification: Contours can be quantified to provide numerical measures of significance, enabling more rigorous statistical analysis and comparison.
Only logged in customers who have purchased this product may leave a review.
Related products
-
- Sale!
Radial Cluster Tree
- Original price was: $ 15.$ 10Current price is: $ 10.
- Add to cart
-
- Sale!
Tidy Tree
- Original price was: $ 15.$ 10Current price is: $ 10.
- Add to cart
-
- Sale!
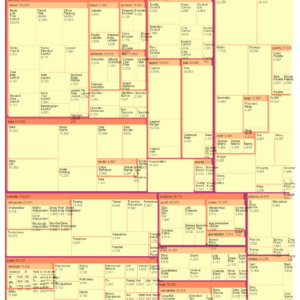
Cascaded Tree Map
- Original price was: $ 15.$ 10Current price is: $ 10.
- Add to cart
Reviews
There are no reviews yet.