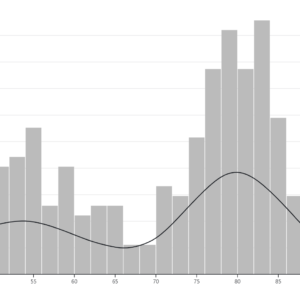
Bar chart transitions refer to the animation effects applied to bar charts when data is updated or modified. These transitions provide a smooth and visually appealing way to visualize changes in data over time or in response to user interactions. Instead of abruptly updating the chart with new data, transitions smoothly animate the bars to their new positions or sizes, making it easier for users to track changes and understand the data dynamics. Bar chart transitions enhance the user experience by providing a clear visual representation of data changes and fostering better comprehension of the underlying trends.
Uses:
Data Updates: Bar chart transitions are used to animate changes in data values, such as when new data is loaded or when existing data is updated dynamically.
Interactive Filtering: When users apply filters or selections to the data, bar chart transitions smoothly update the visualization to reflect the filtered dataset.
Comparative Analysis: Bar chart transitions facilitate comparative analysis by visually transitioning between different datasets or time periods, allowing users to observe changes and trends.
Real-Time Data: In applications where real-time data feeds are used, bar chart transitions provide a smooth visual update as new data points are received.
User Interaction: Interactive elements such as tooltips or hover effects trigger bar chart transitions, providing visual feedback to users when they interact with specific bars.
Sorting: When sorting criteria are applied to the data, bar chart transitions smoothly reposition the bars according to the new sort order, helping users understand the ranking of data elements.
Animation Effects: Bar chart transitions are used to add animation effects to the visualization, making the chart more engaging and dynamic.
Data Driven Updates: Changes in data-driven parameters, such as color encoding or bar width, trigger bar chart transitions to reflect the updated visual attributes.
Storytelling: Bar chart transitions can be used in data storytelling to dynamically reveal insights or highlight key trends as part of a narrative.
Cross-Platform Compatibility: Bar chart transitions ensure consistent visual behavior across different devices and platforms, providing a seamless experience for users accessing the visualization on various devices.
Purposes:
Enhanced User Experience: Bar chart transitions improve the overall user experience by providing smooth and visually appealing updates to the visualization.
Better Data Understanding: By animating changes in data values, bar chart transitions help users better understand the relationships and trends in the data.
Improved Comprehension: The fluid motion of bar chart transitions aids in comprehension, allowing users to track changes and observe patterns more effectively.
Engagement: Dynamic transitions make the visualization more engaging, capturing users’ attention and encouraging interaction with the data.
Feedback Mechanism: Bar chart transitions serve as a feedback mechanism, indicating to users that changes in the data have occurred and providing context for those changes.
Contextualization: Transitions contextualize data updates by showing how individual data points relate to the overall dataset and its evolving trends.
Visualization of Data Dynamics: Bar chart transitions visualize the dynamics of the data, illustrating how it changes over time or in response to user interactions.
Highlighting Changes: By animating changes in data values, bar chart transitions highlight specific data points or trends that are significant or noteworthy.
Seamless Updates: Instead of abruptly updating the chart, transitions ensure that changes are applied smoothly, maintaining the flow of the visualization.
Support for Exploratory Analysis: Bar chart transitions support exploratory data analysis by allowing users to dynamically explore different aspects of the data and observe the effects of their interactions in real time.
Reviews
There are no reviews yet.
Only logged in customers who have purchased this product may leave a review.
")

")
Reviews
There are no reviews yet.