")
Description
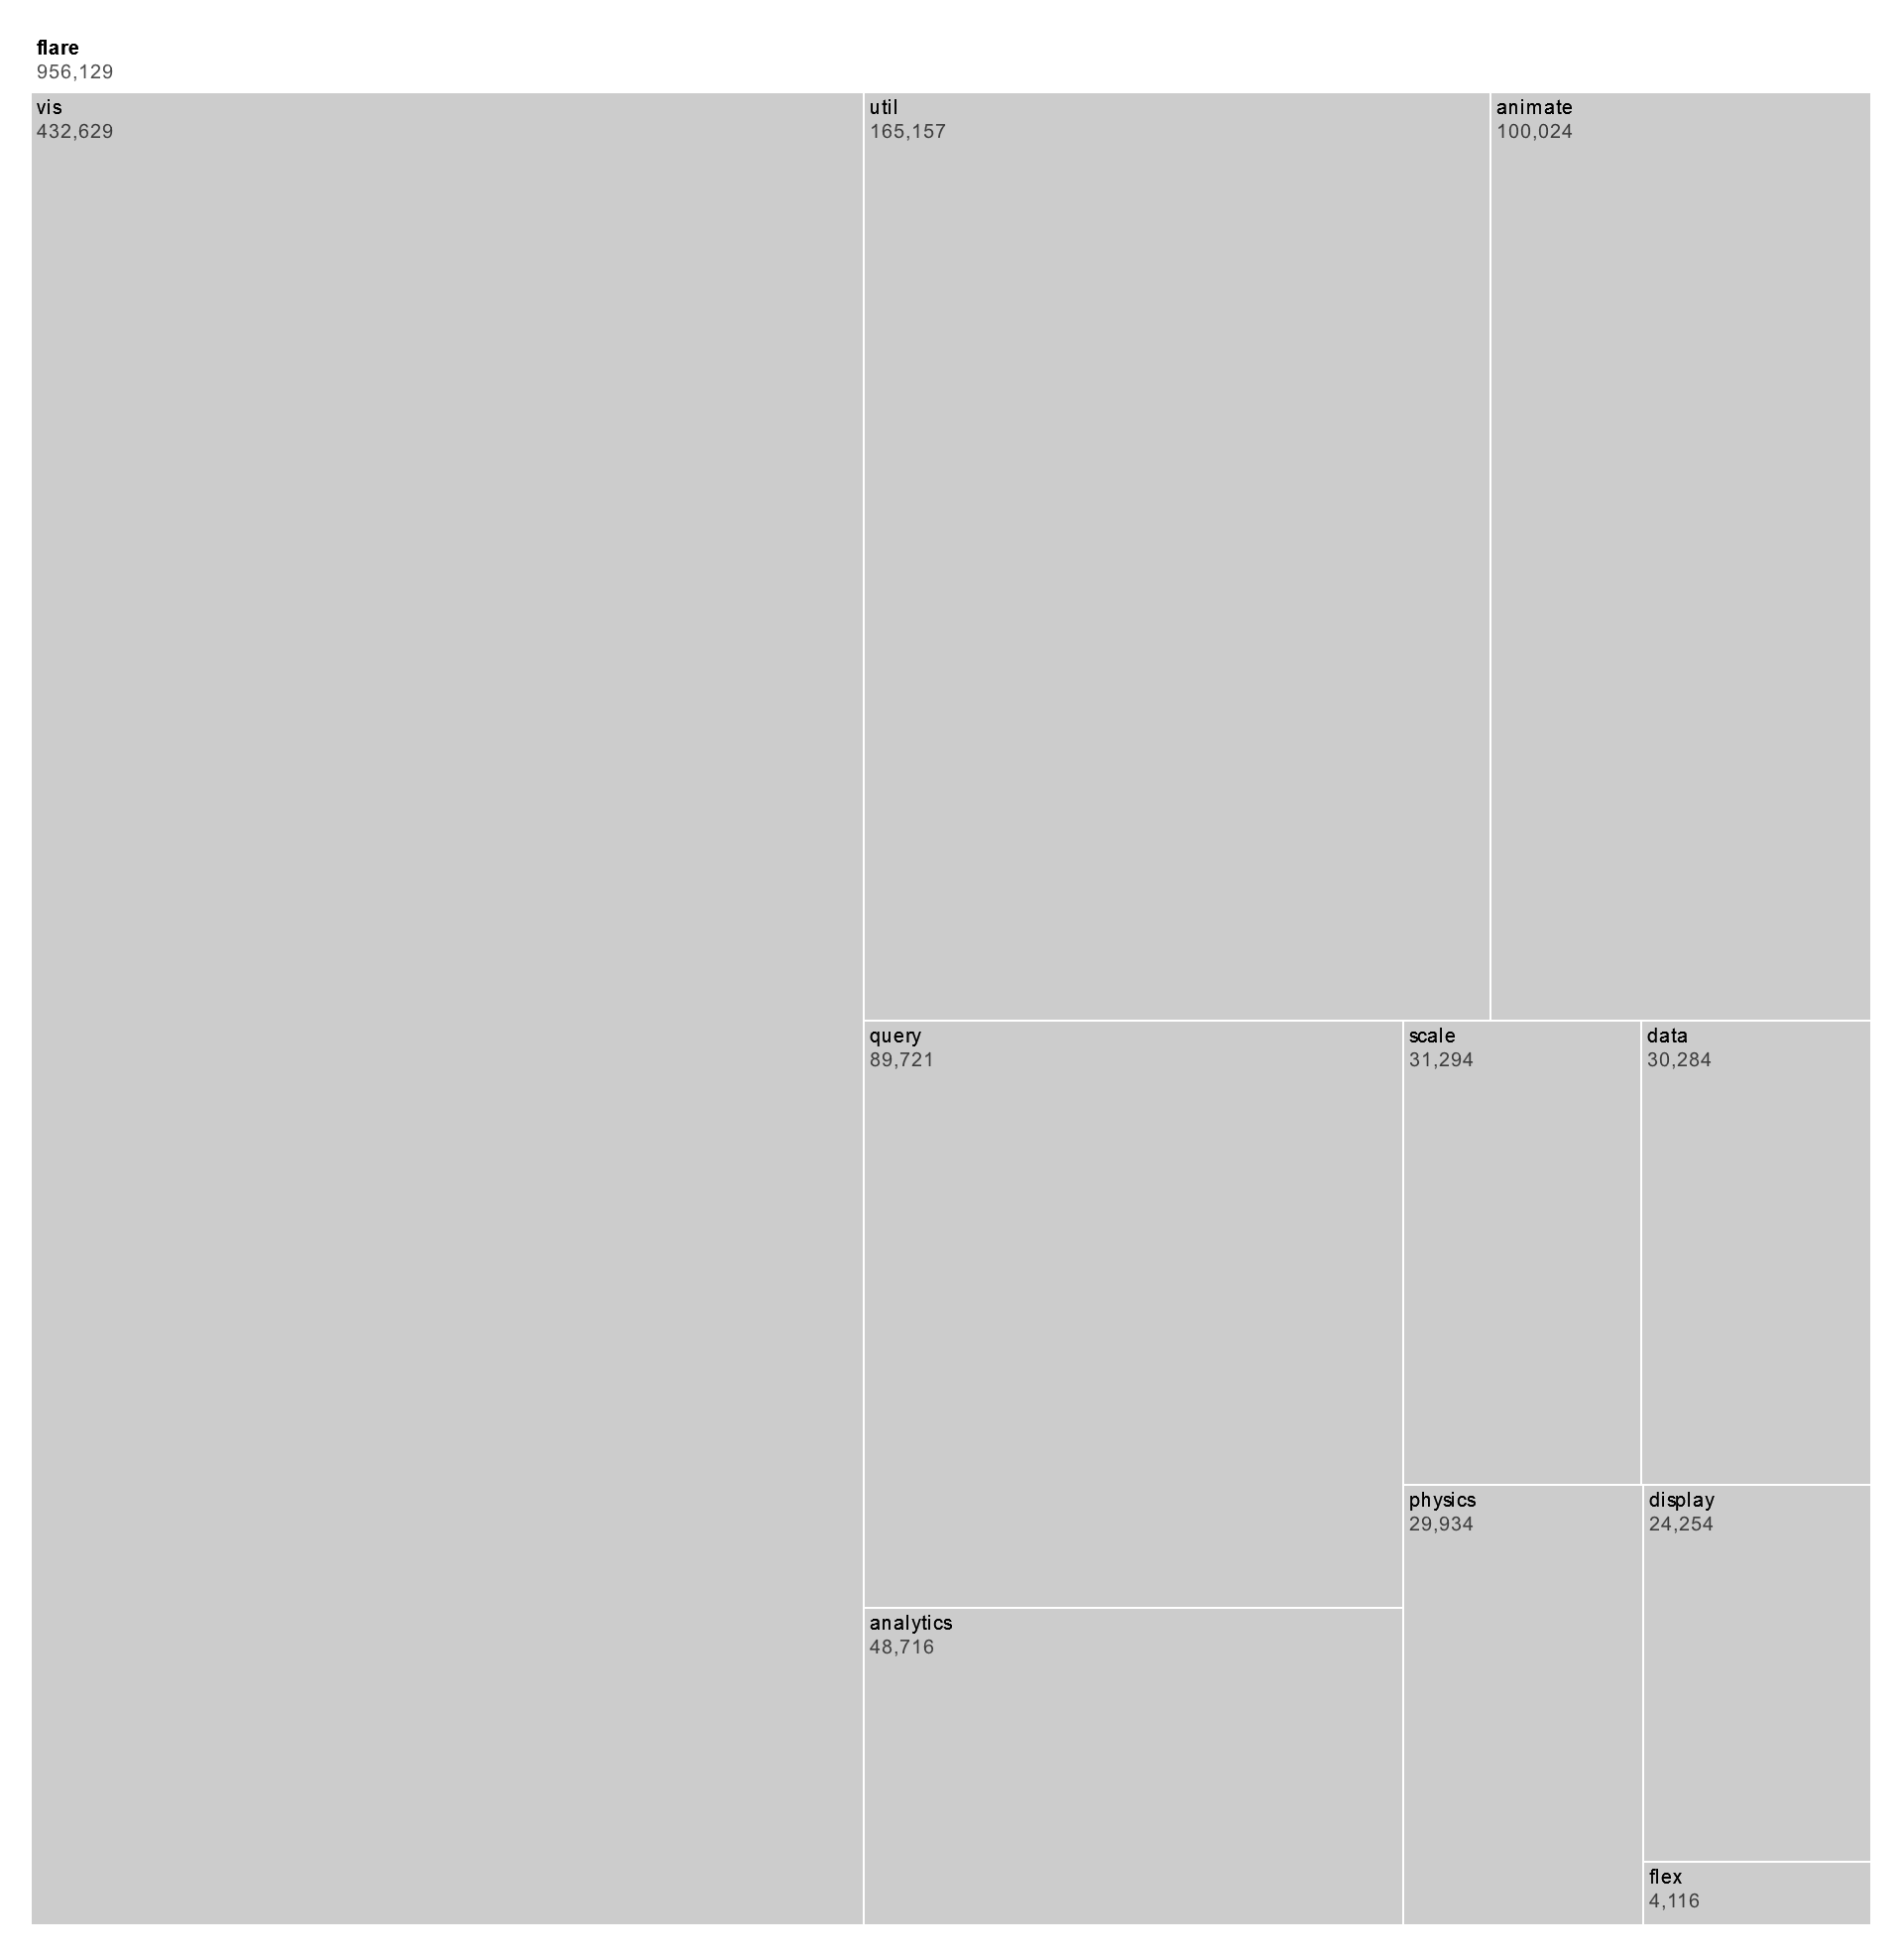
A hierarchical bar chart, also known as a tree map or a nested bar chart, is a visualization tool that represents hierarchical data using nested rectangles or bars. Each rectangle or bar represents a category or subgroup, with the size of the rectangle proportional to a specific metric, such as revenue, population, or frequency. The hierarchical structure is depicted by nesting smaller rectangles within larger ones, illustrating the relationship between parent categories and their respective child categories. Hierarchical bar charts provide an intuitive way to visualize hierarchical data structures and compare the relative sizes of categories within different levels of the hierarchy.
Uses:
- Financial Analysis: Hierarchical bar charts are used in financial analysis to visualize hierarchical data structures such as organizational budgets, expenses, and revenue streams.
- Inventory Management: Businesses use hierarchical bar charts to analyze inventory data, visualizing product categories, subcategories, and stock levels within their warehouses or stores.
- Market Segmentation: Marketers use hierarchical bar charts to segment target markets based on demographic, geographic, or psychographic variables, visualizing customer segments and subsegments.
- Project Management: Project managers use hierarchical bar charts to organize project tasks and subtasks, visualizing task dependencies, timelines, and resource allocation.
- Resource Allocation: Hierarchical bar charts are used to visualize resource allocation within organizations, comparing budgets, expenditures, and allocations across different departments or projects.
- Website Analytics: Web developers and marketers use hierarchical bar charts to analyze website traffic and user behavior, visualizing page views, click-through rates, and conversion rates across site sections.
- Supply Chain Analysis: Supply chain managers use hierarchical bar charts to analyze supply chain data, visualizing product flows, inventory levels, and transportation routes within the supply chain network.
- Education: Educators use hierarchical bar charts to teach hierarchical concepts in subjects such as biology (taxonomy), geography (geographical hierarchy), and sociology (social hierarchy).
- Healthcare Management: Healthcare professionals use hierarchical bar charts to analyze patient data, visualizing patient demographics, medical conditions, and treatment outcomes across different patient groups.
- Retail Analytics: Retailers use hierarchical bar charts to analyze sales data, visualizing product categories, subcategories, and sales performance within their stores or online platforms.
Purposes:
- Hierarchical Structure: Hierarchical bar charts visually represent the hierarchical structure of data, showing parent categories and their respective child categories in a nested format.
- Comparison: Hierarchical bar charts enable users to compare the relative sizes of categories within different levels of the hierarchy, identifying trends, outliers, and patterns.
- Summarization: Hierarchical bar charts provide a summarized view of hierarchical data, allowing users to understand the overall distribution of data across different categories and levels.
- Visualization: Hierarchical bar charts facilitate the visualization of complex hierarchical data structures, making it easier for users to interpret and analyze large datasets.
- Insight Generation: Hierarchical bar charts help users generate insights and identify relationships within hierarchical data, informing decision-making and problem-solving processes.
- Exploration: Hierarchical bar charts support data exploration by allowing users to interactively drill down into different levels of the hierarchy, exploring subcategories and details.
- Communication: Hierarchical bar charts serve as a communication tool for conveying hierarchical data structures and insights to stakeholders, clients, or team members.
- Pattern Recognition: Hierarchical bar charts aid in pattern recognition by visually highlighting trends, clusters, and anomalies within hierarchical data.
- Decision Support: Hierarchical bar charts provide decision-makers with actionable information and recommendations based on the analysis of hierarchical data.
- Efficiency: Hierarchical bar charts improve efficiency in data analysis by providing a clear and intuitive visualization of hierarchical data, reducing the time and effort required for interpretation and understanding.
Only logged in customers who have purchased this product may leave a review.
Related products
-
- Sale!
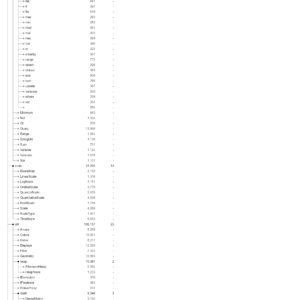
Indented Tree
- Original price was: $ 15.$ 10Current price is: $ 10.
- Add to cart
-
- Sale!
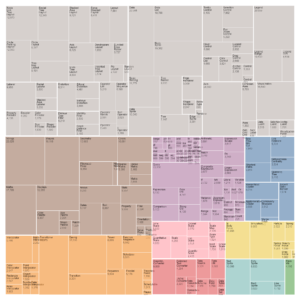
Tree Map
- Original price was: $ 15.$ 10Current price is: $ 10.
- Add to cart
-
- Sale!
Q-Q Plot
- Original price was: $ 15.$ 10Current price is: $ 10.
- Add to cart
Reviews
There are no reviews yet.