Description
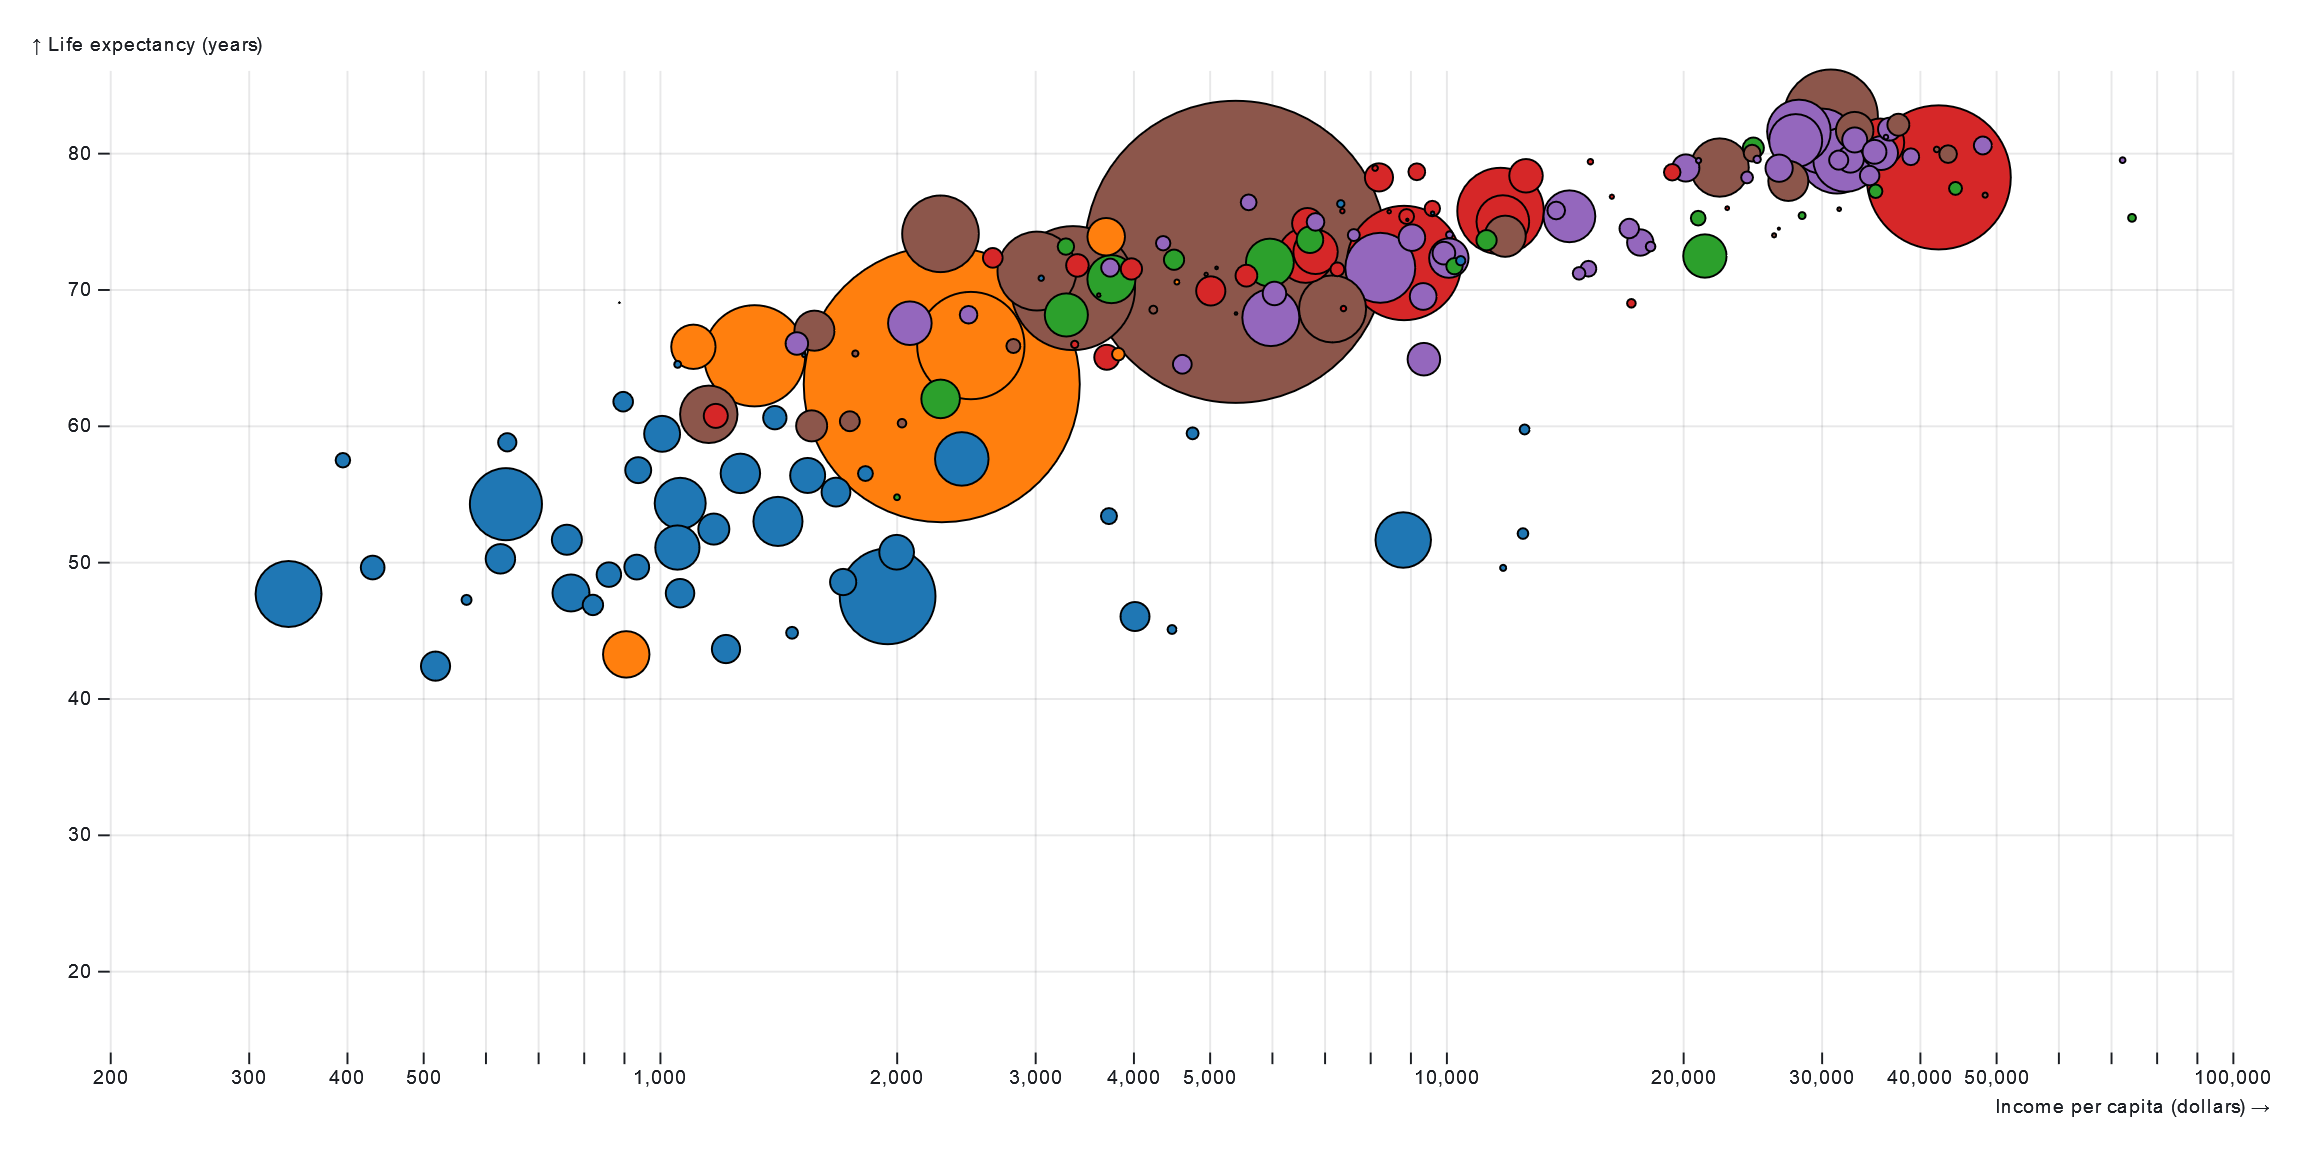
A Scatterplot Tour is an interactive data visualization technique used for exploring multivariate datasets. Unlike traditional scatterplots, where only two variables are visualized at a time, a Scatterplot Tour allows users to navigate through multiple dimensions of data by dynamically displaying different combinations of variables in a series of scatterplots. This dynamic exploration is often facilitated through interactive controls or animations that cycle through various combinations of variables, allowing users to quickly identify patterns, correlations, and outliers within the dataset. Scatterplot Tours are particularly useful for analyzing high-dimensional datasets and uncovering complex relationships between multiple variables, making them valuable tools for data exploration and hypothesis generation in fields such as data science, statistics, and machine learning.
Uses:
- Multivariate Analysis: Exploring relationships between multiple variables simultaneously to uncover complex patterns and correlations within the data.
- Dimensionality Reduction: Visualizing high-dimensional datasets in a lower-dimensional space to identify important variables and reduce the complexity of analysis.
- Outlier Detection: Identifying outliers or anomalies within the data by observing patterns of deviation across multiple dimensions.
- Pattern Recognition: Recognizing recurring patterns or clusters within the data by observing consistent trends across different combinations of variables.
- Variable Selection: Selecting relevant variables for further analysis based on their relationships with other variables observed during the scatterplot tour.
- Data Preprocessing: Identifying data preprocessing steps such as normalization, scaling, or transformation based on the observed distribution of variables.
- Feature Engineering: Generating new features or variables by observing interactions or nonlinear relationships between existing variables.
- Model Building: Informing the selection and tuning of machine learning models by identifying informative features and potential predictors.
- Data Validation: Validating assumptions or hypotheses about relationships between variables by visually inspecting their associations in the scatterplot tour.
- Exploratory Data Analysis: Conducting exploratory data analysis to gain insights into the structure and characteristics of the dataset before performing more in-depth statistical analysis or modeling.
Purposes:
- Visual Exploration: Providing a visual exploration tool for navigating through multivariate datasets and uncovering hidden patterns or relationships.
- Hypothesis Generation: Generating hypotheses or research questions based on observed patterns and associations within the data.
- Model Interpretation: Interpreting machine learning models by visualizing the relationships between input variables and model predictions.
- Quality Assurance: Assessing the quality and integrity of the data by identifying inconsistencies, errors, or missing values across different variables.
- Data Understanding: Improving understanding of the dataset and its underlying structure by visually inspecting relationships between variables.
- Insight Discovery: Discovering new insights or perspectives on the data by exploring it from multiple angles and perspectives.
- Communication: Communicating complex relationships or findings within the data to stakeholders or collaborators in an intuitive and accessible manner.
- Decision Support: Providing decision-makers with actionable insights derived from the analysis of multivariate data to inform strategic decisions.
- Educational Tool: Serving as an educational tool for teaching concepts related to data visualization, exploratory data analysis, and multivariate analysis.
- Problem Solving: Using visual exploration to solve complex problems or answer specific research questions by analyzing relationships between variables in the dataset.
Only logged in customers who have purchased this product may leave a review.
Related products
-
- Sale!
Q-Q Plot
- Original price was: $ 15.$ 10Current price is: $ 10.
- Add to cart
-
- Sale!
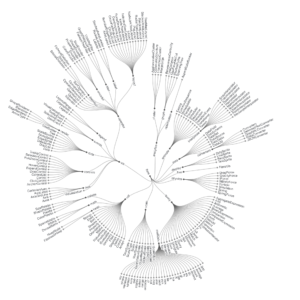
Radial Tidy Tree
- Original price was: $ 15.$ 10Current price is: $ 10.
- Add to cart
-
- Sale!
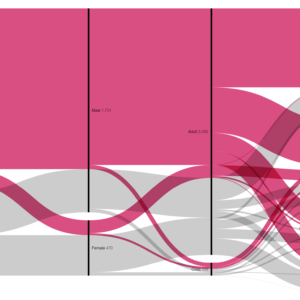
Parallel Sets
- Original price was: $ 15.$ 10Current price is: $ 10.
- Add to cart
Reviews
There are no reviews yet.