Description
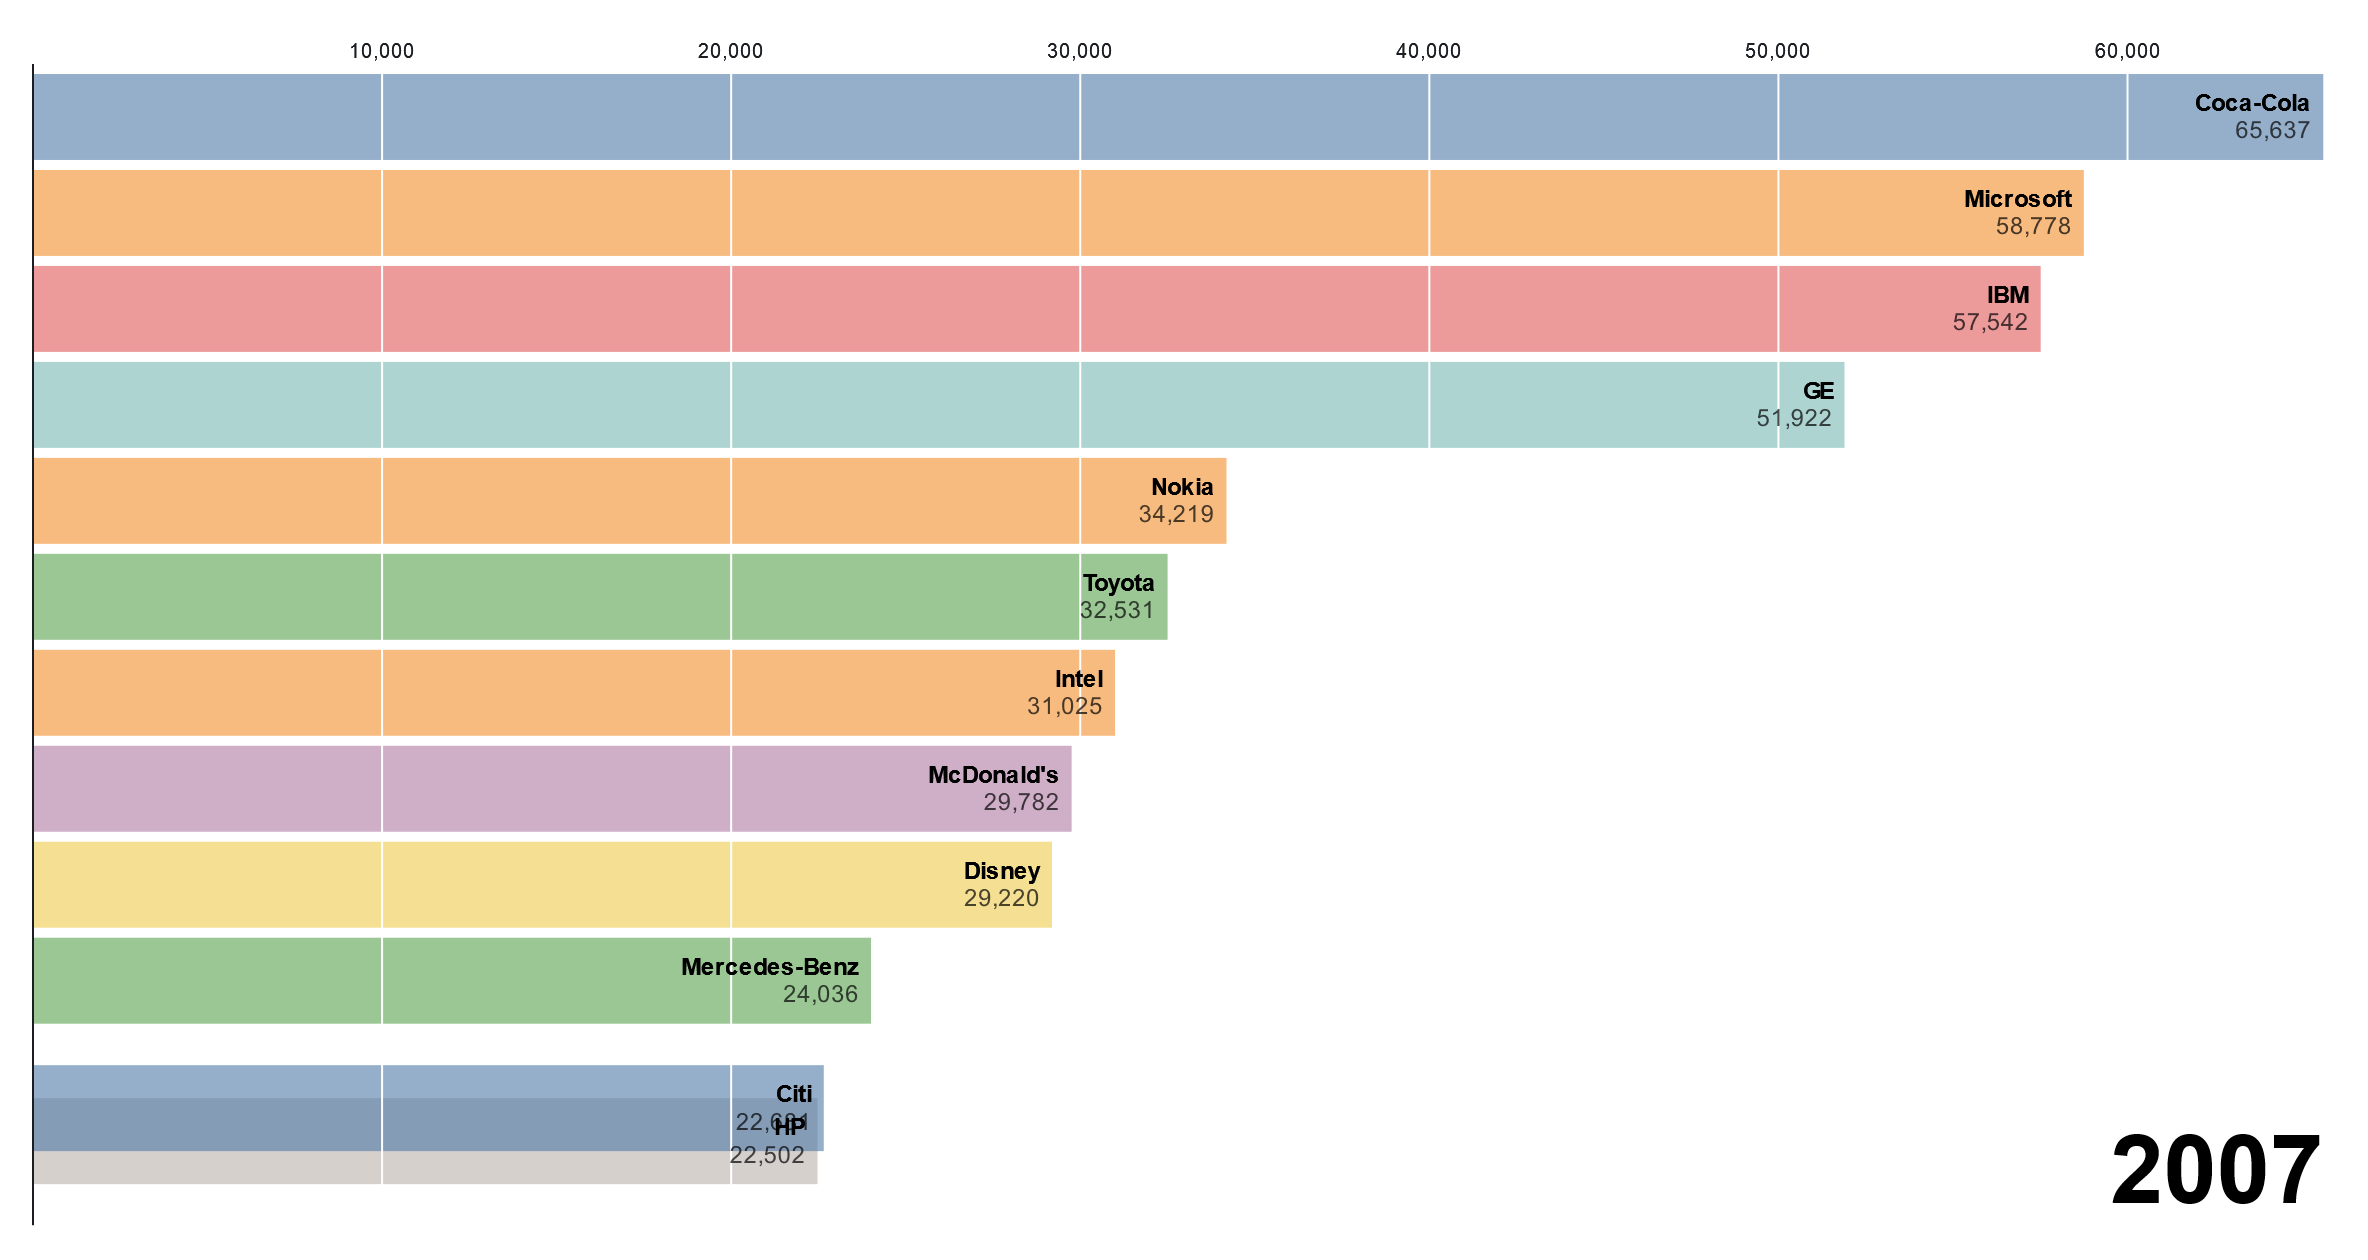
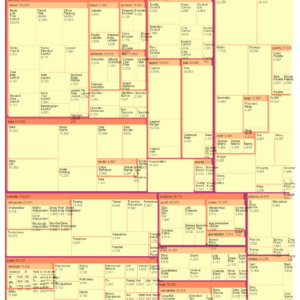
Stacked-to-grouped bars is a dynamic and versatile data visualization technique that combines the features of stacked and grouped bar charts. In this visualization, data is initially presented in a stacked bar format, where each bar is divided into segments representing different categories or subgroups. However, upon interaction or animation, the stacked bars can transition into grouped bars, where each subgroup is represented as a distinct bar within the group. This transition provides users with a flexible way to explore both the aggregate distribution of data across categories (in the stacked format) and the individual contributions of subgroups within each category (in the grouped format). Stacked-to-grouped bars are effective for visualizing hierarchical or nested data structures and for comparing the overall distribution of data with the contributions of individual subgroups.
Uses:
- Comparing Total vs. Component Values: Users can compare the total value represented by each stacked bar with the individual contributions of subgroups when transitioning to grouped bars.
- Visualizing Hierarchical Data: Stacked-to-grouped bars are useful for visualizing hierarchical or nested data structures where categories can be further subdivided into subgroups.
- Understanding Composition Changes: Users can observe how the composition of each category changes when transitioning from stacked to grouped bars, revealing shifts in subgroup distributions.
- Exploring Categorical Trends: Analyzing trends and patterns within categorical data by examining changes in the distribution of subgroups across categories.
- Comparing Across Categories: Users can compare the distribution of subgroups across different categories more easily in the grouped format, facilitating cross-category analysis.
- Identifying Outliers: Detecting outliers or anomalies within subgroups by visually inspecting their contributions relative to the total value of each category.
- Highlighting Subgroup Variations: Stacked-to-grouped bars allow users to highlight variations or disparities between subgroups within each category more effectively.
- Tracking Changes Over Time: When used in a time-series context, users can track changes in subgroup distributions over time by animating transitions between stacked and grouped bars.
- Facilitating Interactive Exploration: Interactive features can enable users to dynamically toggle between stacked and grouped formats, providing a more interactive and engaging exploration experience.
- Enhancing Presentation Impact: Stacked-to-grouped bars offer a visually compelling way to present complex data structures and facilitate audience comprehension through dynamic transitions.
Purposes:
- Comparison: Facilitating comparisons between the aggregate distribution of data and the contributions of individual subgroups within categories.
- Pattern Identification: Helping users identify patterns or trends within categorical data by examining changes in subgroup distributions.
- Insight Generation: Enabling users to generate insights into the composition and distribution of data across categories and subgroups.
- Communication: Serving as an effective communication tool for conveying complex data relationships and structures to stakeholders or audiences.
- Decision Support: Providing decision-makers with actionable insights derived from the analysis of categorical data and subgroup distributions.
- Data Exploration: Supporting exploratory data analysis by allowing users to interactively explore and visualize hierarchical data structures.
- Educational Tool: Acting as an educational tool for teaching concepts related to data visualization, categorical analysis, and hierarchical data structures.
- Problem Solving: Assisting users in solving complex problems or answering specific research questions by analyzing categorical data distributions.
- Validation: Validating assumptions or hypotheses about the distribution of data across categories and subgroups through visual inspection.
- Enhanced Understanding: Enhancing user understanding of categorical data distributions and subgroup contributions through interactive visualization and exploration.
Only logged in customers who have purchased this product may leave a review.
Related products
-
- Sale!
- Original price was: $ 15.$ 10Current price is: $ 10.
- Add to cart
-
- Sale!
Cascaded Tree Map
- Original price was: $ 15.$ 10Current price is: $ 10.
- Add to cart
-
- Sale!
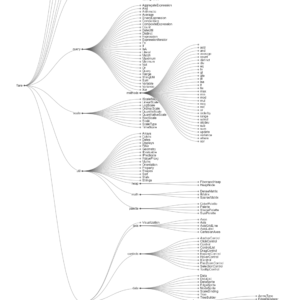
Tidy Tree
- Original price was: $ 15.$ 10Current price is: $ 10.
- Add to cart
Reviews
There are no reviews yet.