")
Description
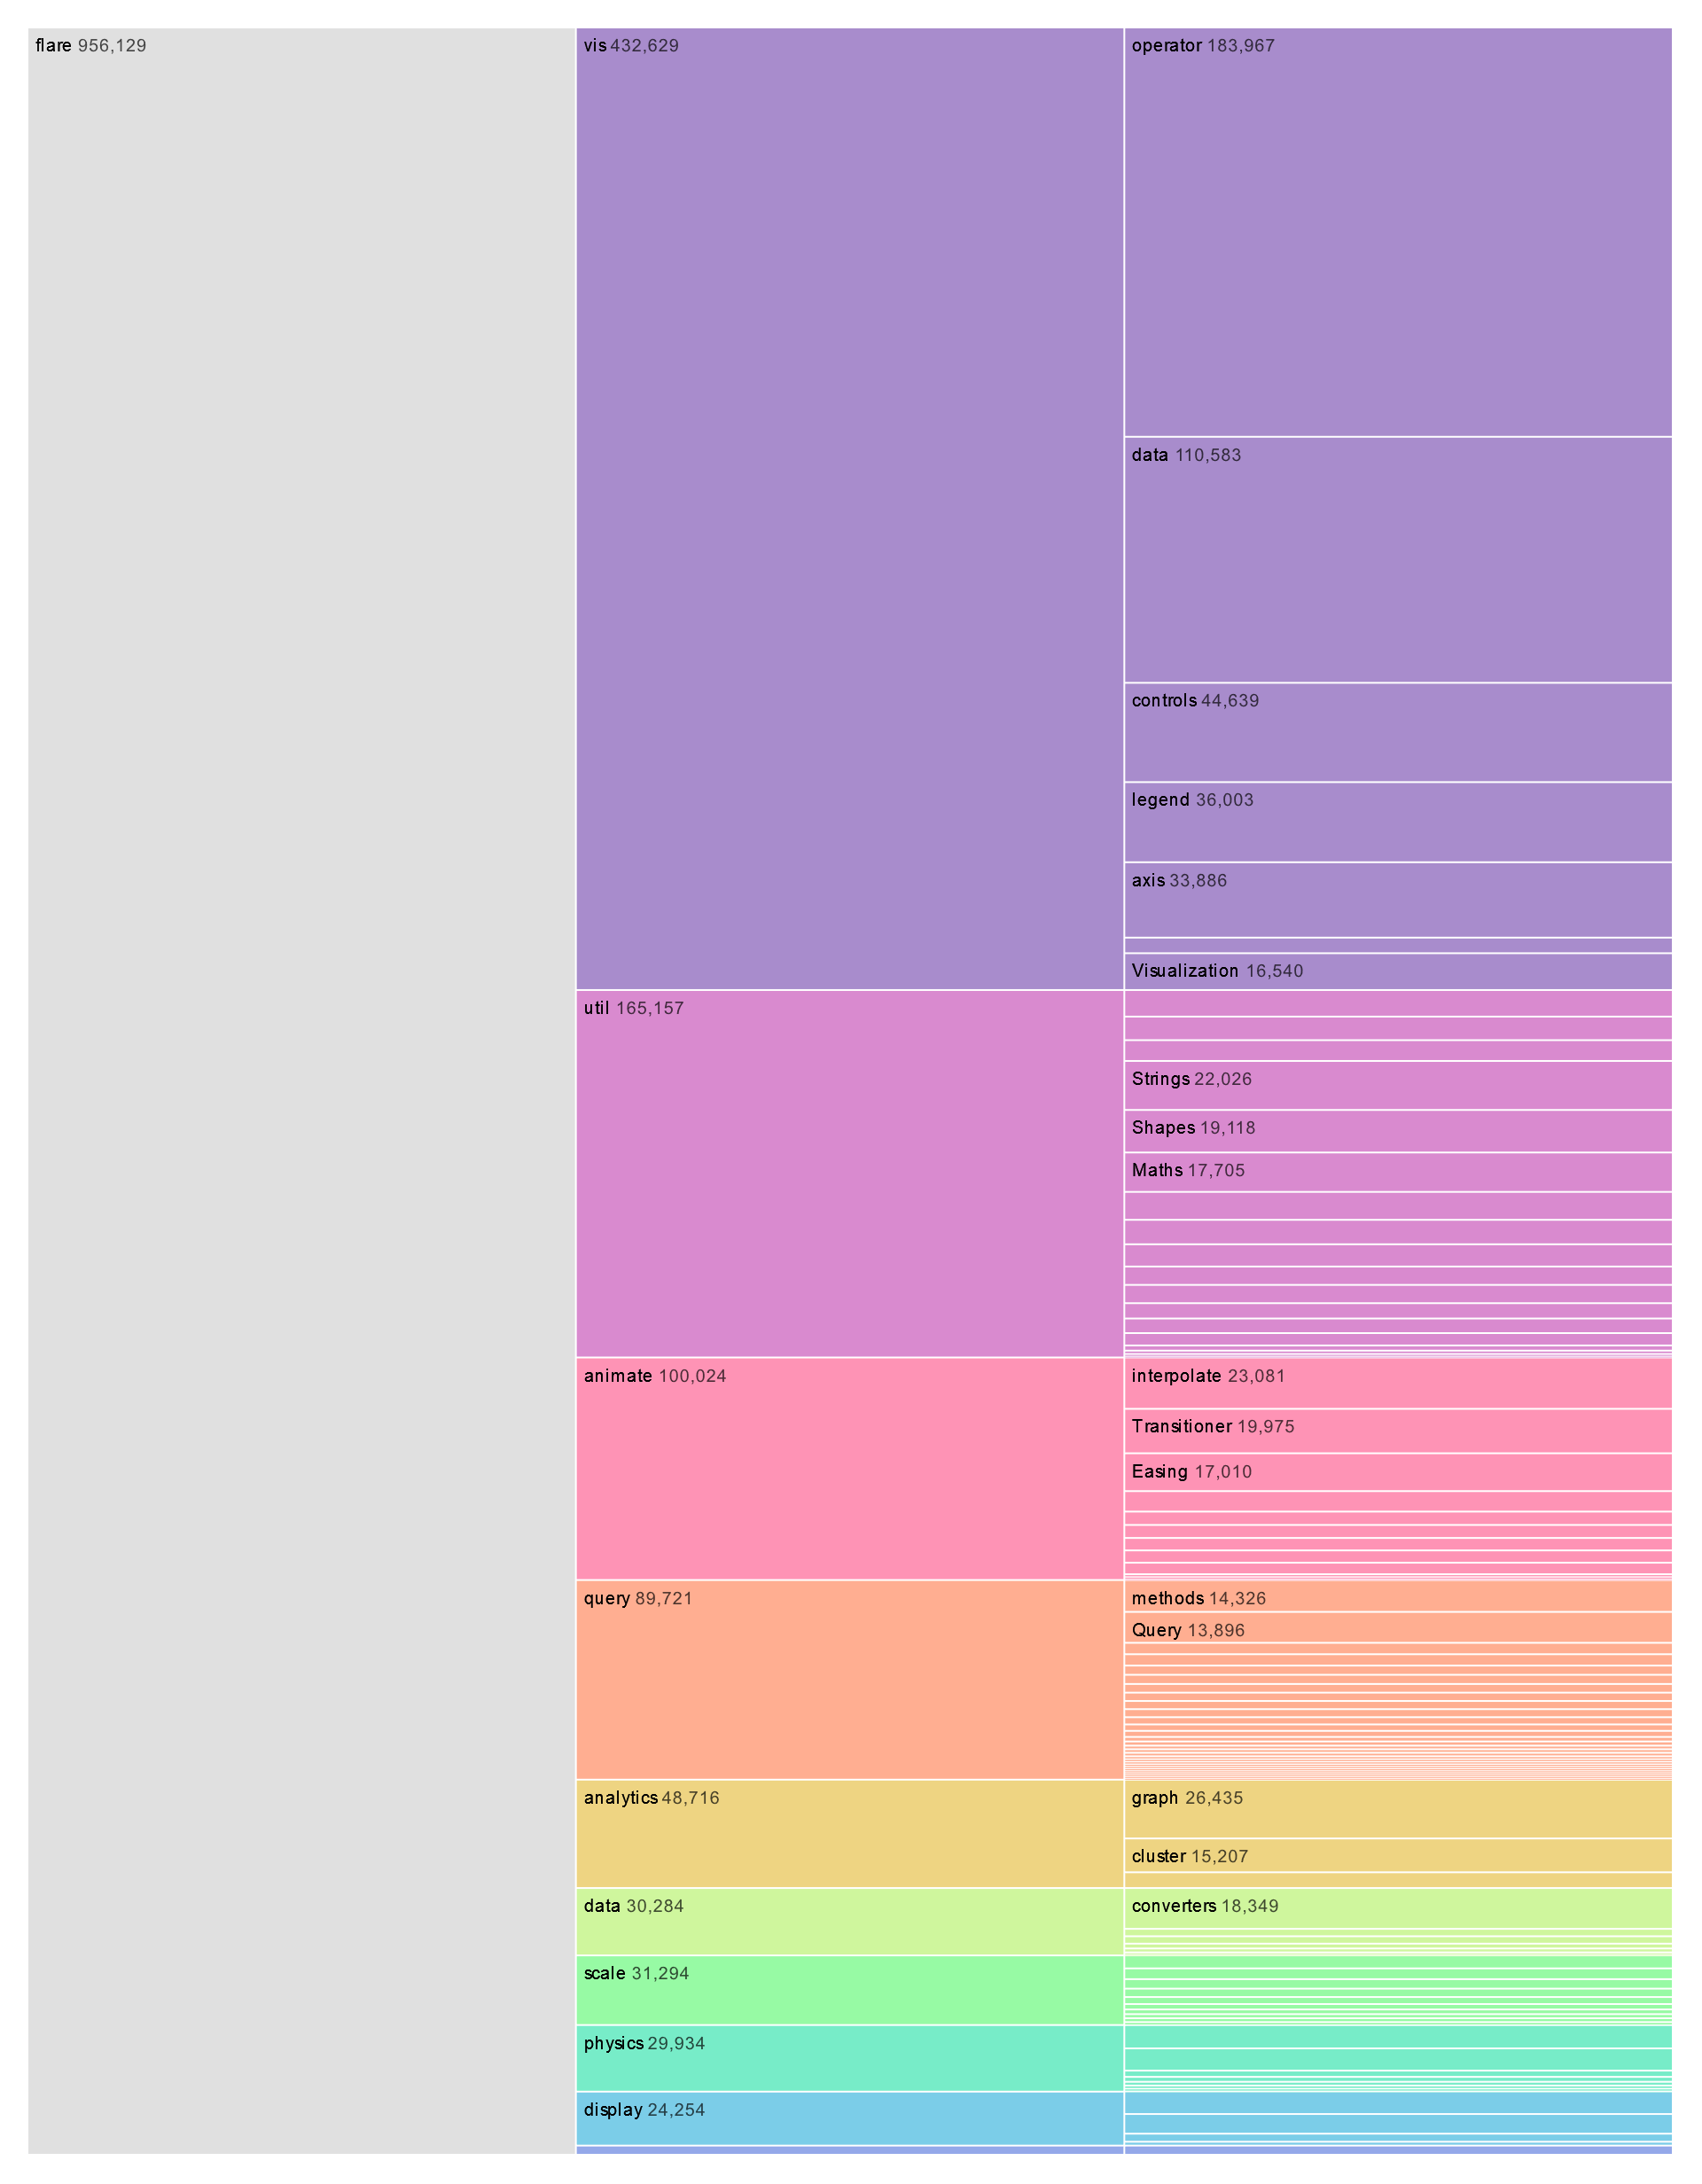
A zoomable sunburst is an interactive data visualization that represents hierarchical data in a radial layout resembling the structure of a sunburst or a concentric circle. Each ring of the sunburst represents a level in the hierarchy, with the innermost ring representing the root node and subsequent rings representing child nodes. The size of each segment within the rings corresponds to a specific metric, such as frequency or magnitude, while the color coding may indicate different categories or attributes. Users can interact with the zoomable sunburst by zooming in and out to explore different levels of the hierarchy, revealing more detailed information as they navigate through the data. Zoomable sunbursts provide a visually engaging way to analyze hierarchical datasets, enabling users to identify patterns, trends, and relationships within the data.
Uses:
- Financial Analysis: Zoomable sunbursts are used in financial analysis to visualize hierarchical data structures such as budget allocations, expenditure breakdowns, and revenue streams.
- Market Analysis: Market analysts use zoomable sunbursts to analyze market segmentation data, visualizing customer segments, subsegments, and market shares within different product categories.
- Inventory Management: Businesses use zoomable sunbursts to analyze inventory data, visualizing product categories, subcategories, and stock levels within their warehouses or stores.
- Website Analytics: Web developers and marketers use zoomable sunbursts to analyze website traffic and user behavior, visualizing page views, click-through rates, and conversion rates across different website sections.
- Supply Chain Management: Supply chain managers use zoomable sunbursts to analyze supply chain data, visualizing product flows, inventory levels, and transportation routes within the supply chain network.
- Project Management: Project managers use zoomable sunbursts to organize project tasks and subtasks, visualizing task dependencies, timelines, and resource allocation.
- Healthcare Analytics: Healthcare professionals use zoomable sunbursts to analyze patient data, visualizing patient demographics, medical conditions, and treatment outcomes across different patient groups.
- Retail Analytics: Retailers use zoomable sunbursts to analyze sales data, visualizing product categories, subcategories, and sales performance within their stores or online platforms.
- Educational Visualization: Educators use zoomable sunbursts to teach hierarchical concepts in subjects such as biology (taxonomy), geography (geographical hierarchy), and sociology (social hierarchy).
- Business Intelligence: Organizations use zoomable sunbursts as part of their business intelligence tools to analyze complex hierarchical datasets and derive actionable insights for decision-making.
Purposes:
- Hierarchical Visualization: Zoomable sunbursts visually represent hierarchical data structures, providing an intuitive way to explore relationships and hierarchies within the data.
- Interactive Exploration: Zoomable sunbursts support interactive exploration, allowing users to navigate through different levels of the hierarchy and drill down into specific details.
- Data Comparison: Zoomable sunbursts enable users to compare the sizes of different categories and subcategories within the hierarchy, identifying trends, outliers, and patterns.
- Summarization: Zoomable sunbursts provide a summarized view of hierarchical data, allowing users to understand the overall distribution of data across different categories and levels.
- Insight Generation: Zoomable sunbursts help users generate insights and identify relationships within hierarchical data, informing decision-making and problem-solving processes.
- Communication: Zoomable sunbursts serve as a communication tool for conveying hierarchical data structures and insights to stakeholders, clients, or team members.
- Pattern Recognition: Zoomable sunbursts aid in pattern recognition by visually highlighting trends, clusters, and anomalies within hierarchical data.
- Decision Support: Zoomable sunbursts provide decision-makers with actionable information and recommendations based on the analysis of hierarchical data.
- Efficiency: Zoomable sunbursts improve efficiency in data analysis by providing a clear and intuitive visualization of hierarchical data, reducing the time and effort required for interpretation and understanding.
- Exploratory Data Analysis: Zoomable sunbursts support exploratory data analysis by enabling users to interactively explore and analyze complex hierarchical datasets, uncovering insights and trends that may not be apparent through traditional methods.
Only logged in customers who have purchased this product may leave a review.
Related products
-
- Sale!
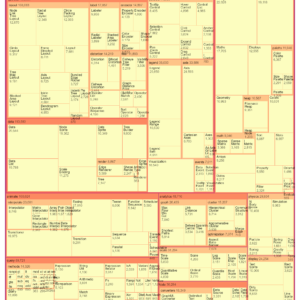
Nested Tree Map
- Original price was: $ 15.$ 10Current price is: $ 10.
- Add to cart
-
- Sale!
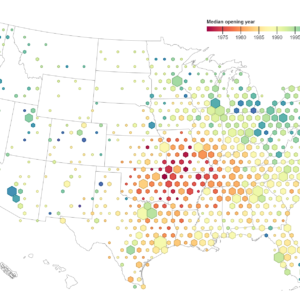
Hexbin Map
- Original price was: $ 15.$ 10Current price is: $ 10.
- Add to cart
-
- Sale!
Box Plot
- Original price was: $ 15.$ 10Current price is: $ 10.
- Add to cart
Reviews
There are no reviews yet.