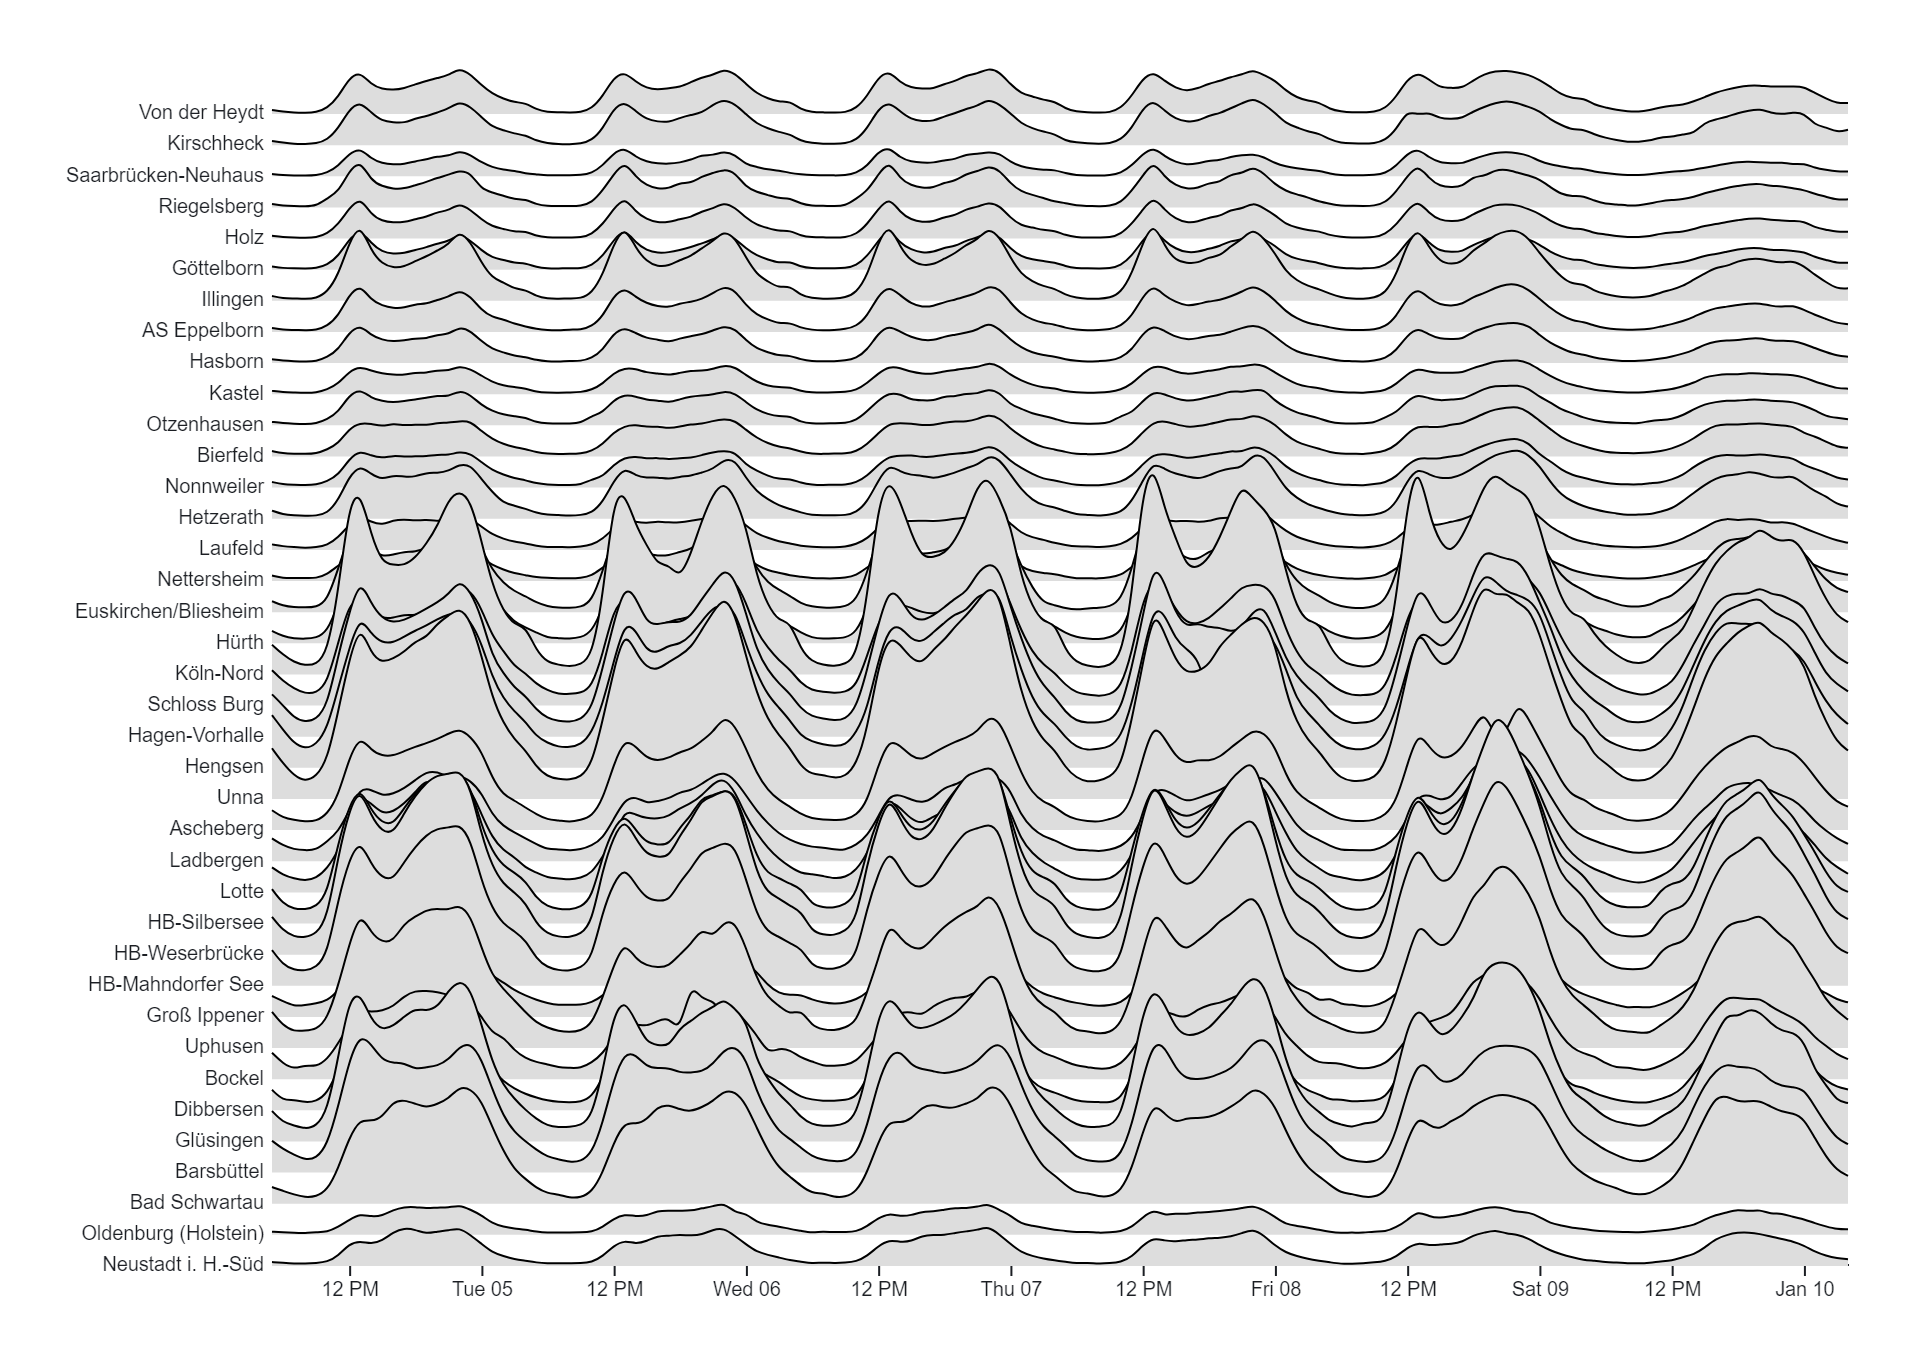
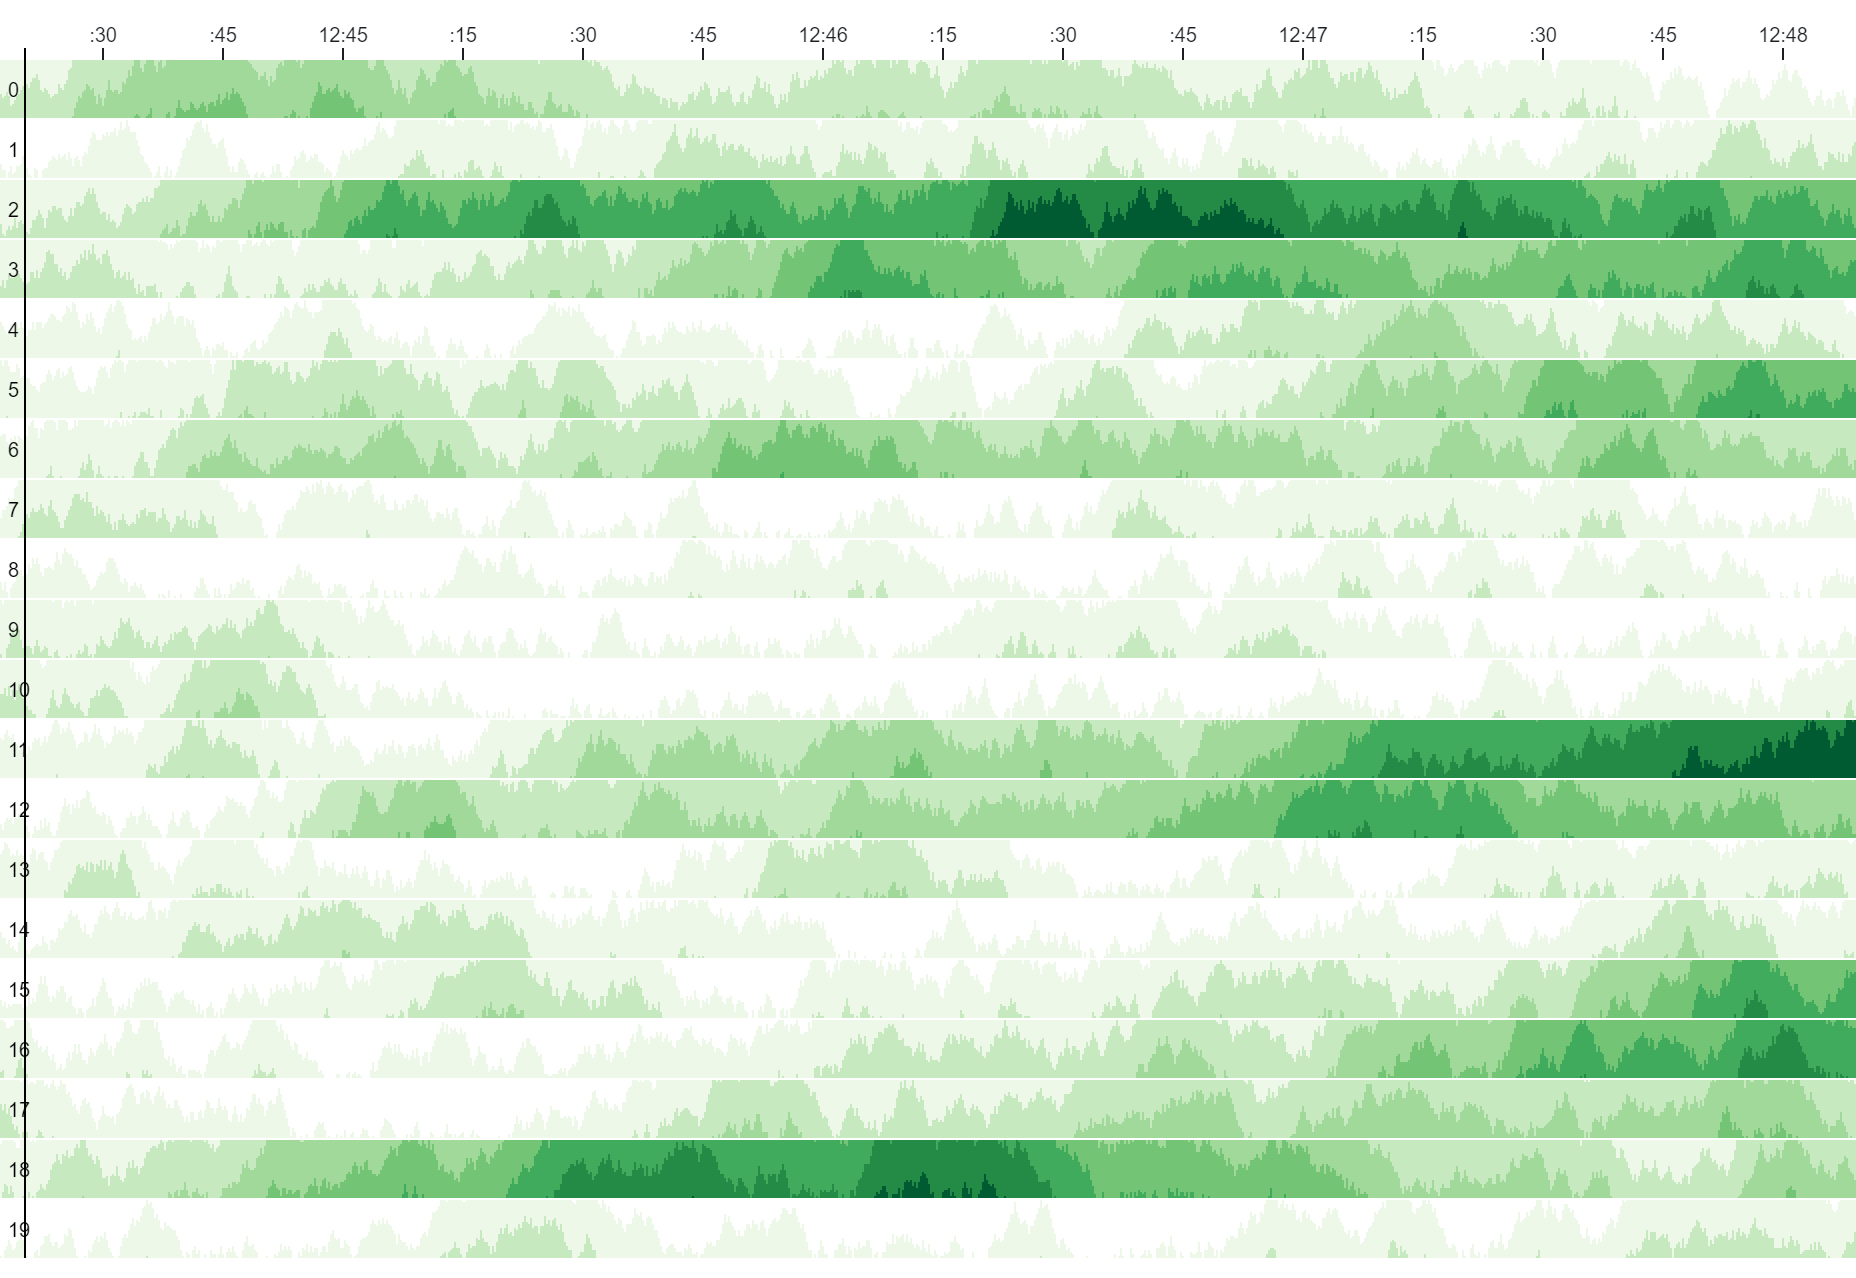
Horizon charts are a specialized form of data visualization designed to efficiently display large datasets with time series or sequential data. They are particularly useful when dealing with high-volume datasets that might overwhelm traditional line charts or bar graphs. Horizon charts partition the data into horizontal bands, with each band representing a portion of the dataset’s range. These bands are then stacked on top of each other, with each subsequent band offset vertically to avoid overlap. The color intensity within each band conveys the magnitude or density of the data values, with darker shades indicating higher values or concentrations. By compressing the data vertically and utilizing color gradients, horizon charts provide a compact yet informative representation of the dataset’s trends and patterns over time. This visualization technique allows users to quickly identify trends, anomalies, or patterns within the data while effectively managing visual clutter. Horizon charts are commonly used in fields such as finance, where they help analyze stock prices or market trends, and in environmental science, where they visualize time series data such as temperature fluctuations or air quality measurements. Overall, horizon charts offer a visually compelling and efficient way to explore and understand large datasets with temporal or sequential data.
Uses:
- Large Dataset Visualization: Horizon charts are used to visualize large datasets efficiently, particularly those with time series or sequential data, by compressing the data vertically.
- Trend Analysis: They aid in trend analysis by allowing users to identify patterns, trends, and anomalies within the dataset over time.
- Anomaly Detection: Horizon charts help detect anomalies or outliers within the data by highlighting deviations from the typical patterns or trends.
- Comparative Analysis: They support comparative analysis by allowing users to compare multiple time series or datasets side by side within a single horizon chart.
- Forecasting: Horizon charts facilitate forecasting future trends or predictions based on historical data, enabling users to make informed decisions.
- Monitoring Metrics: They are used to monitor various metrics, KPIs, or key indicators over time, providing stakeholders with real-time insights into performance.
- Financial Analysis: Horizon charts are commonly used in finance to analyze stock prices, market trends, or trading volumes, helping investors make informed decisions.
- Environmental Monitoring: They aid in environmental monitoring by visualizing time series data such as temperature fluctuations, air quality measurements, or precipitation levels.
- Resource Planning: Horizon charts support resource planning and allocation by visualizing resource usage patterns or demand trends over time.
- Performance Evaluation: They help evaluate the performance of strategies, campaigns, or initiatives over time, enabling organizations to track progress and make data-driven decisions.
Purposes:
- Efficient Data Visualization: The primary purpose of horizon charts is to efficiently visualize large datasets with time series or sequential data, allowing users to explore trends and patterns without visual clutter.
- Trend Identification: They aid in identifying trends within the data by compressing the vertical space and utilizing color gradients to represent data density or magnitude.
- Anomaly Detection: Horizon charts facilitate anomaly detection by highlighting deviations from the typical patterns or trends, enabling users to identify outliers or irregularities within the data.
- Comparative Analysis: They support comparative analysis by allowing users to compare multiple time series or datasets within a single visualization, facilitating data-driven insights and decision-making.
- Forecasting and Prediction: Horizon charts aid in forecasting future trends or predictions based on historical data, providing stakeholders with valuable insights for planning and strategy development.
- Real-time Monitoring: They enable real-time monitoring of metrics, KPIs, or key indicators, allowing stakeholders to track performance and make timely interventions as needed.
- Decision Support: Horizon charts provide decision support by presenting data in a visually compelling and informative format, enabling stakeholders to make informed decisions based on data-driven insights.
- Industry Applications: They find applications across various industries such as finance, environmental science, healthcare, and manufacturing, where analyzing time series data is critical for operations and decision-making.
- Data Exploration: Horizon charts facilitate data exploration by allowing users to interactively explore trends and patterns within the dataset, gaining insights and understanding the underlying dynamics.
- Communication: They serve as a communication tool for presenting complex data in a visually accessible format, allowing stakeholders to grasp key insights and trends at a glance.
Reviews
There are no reviews yet.