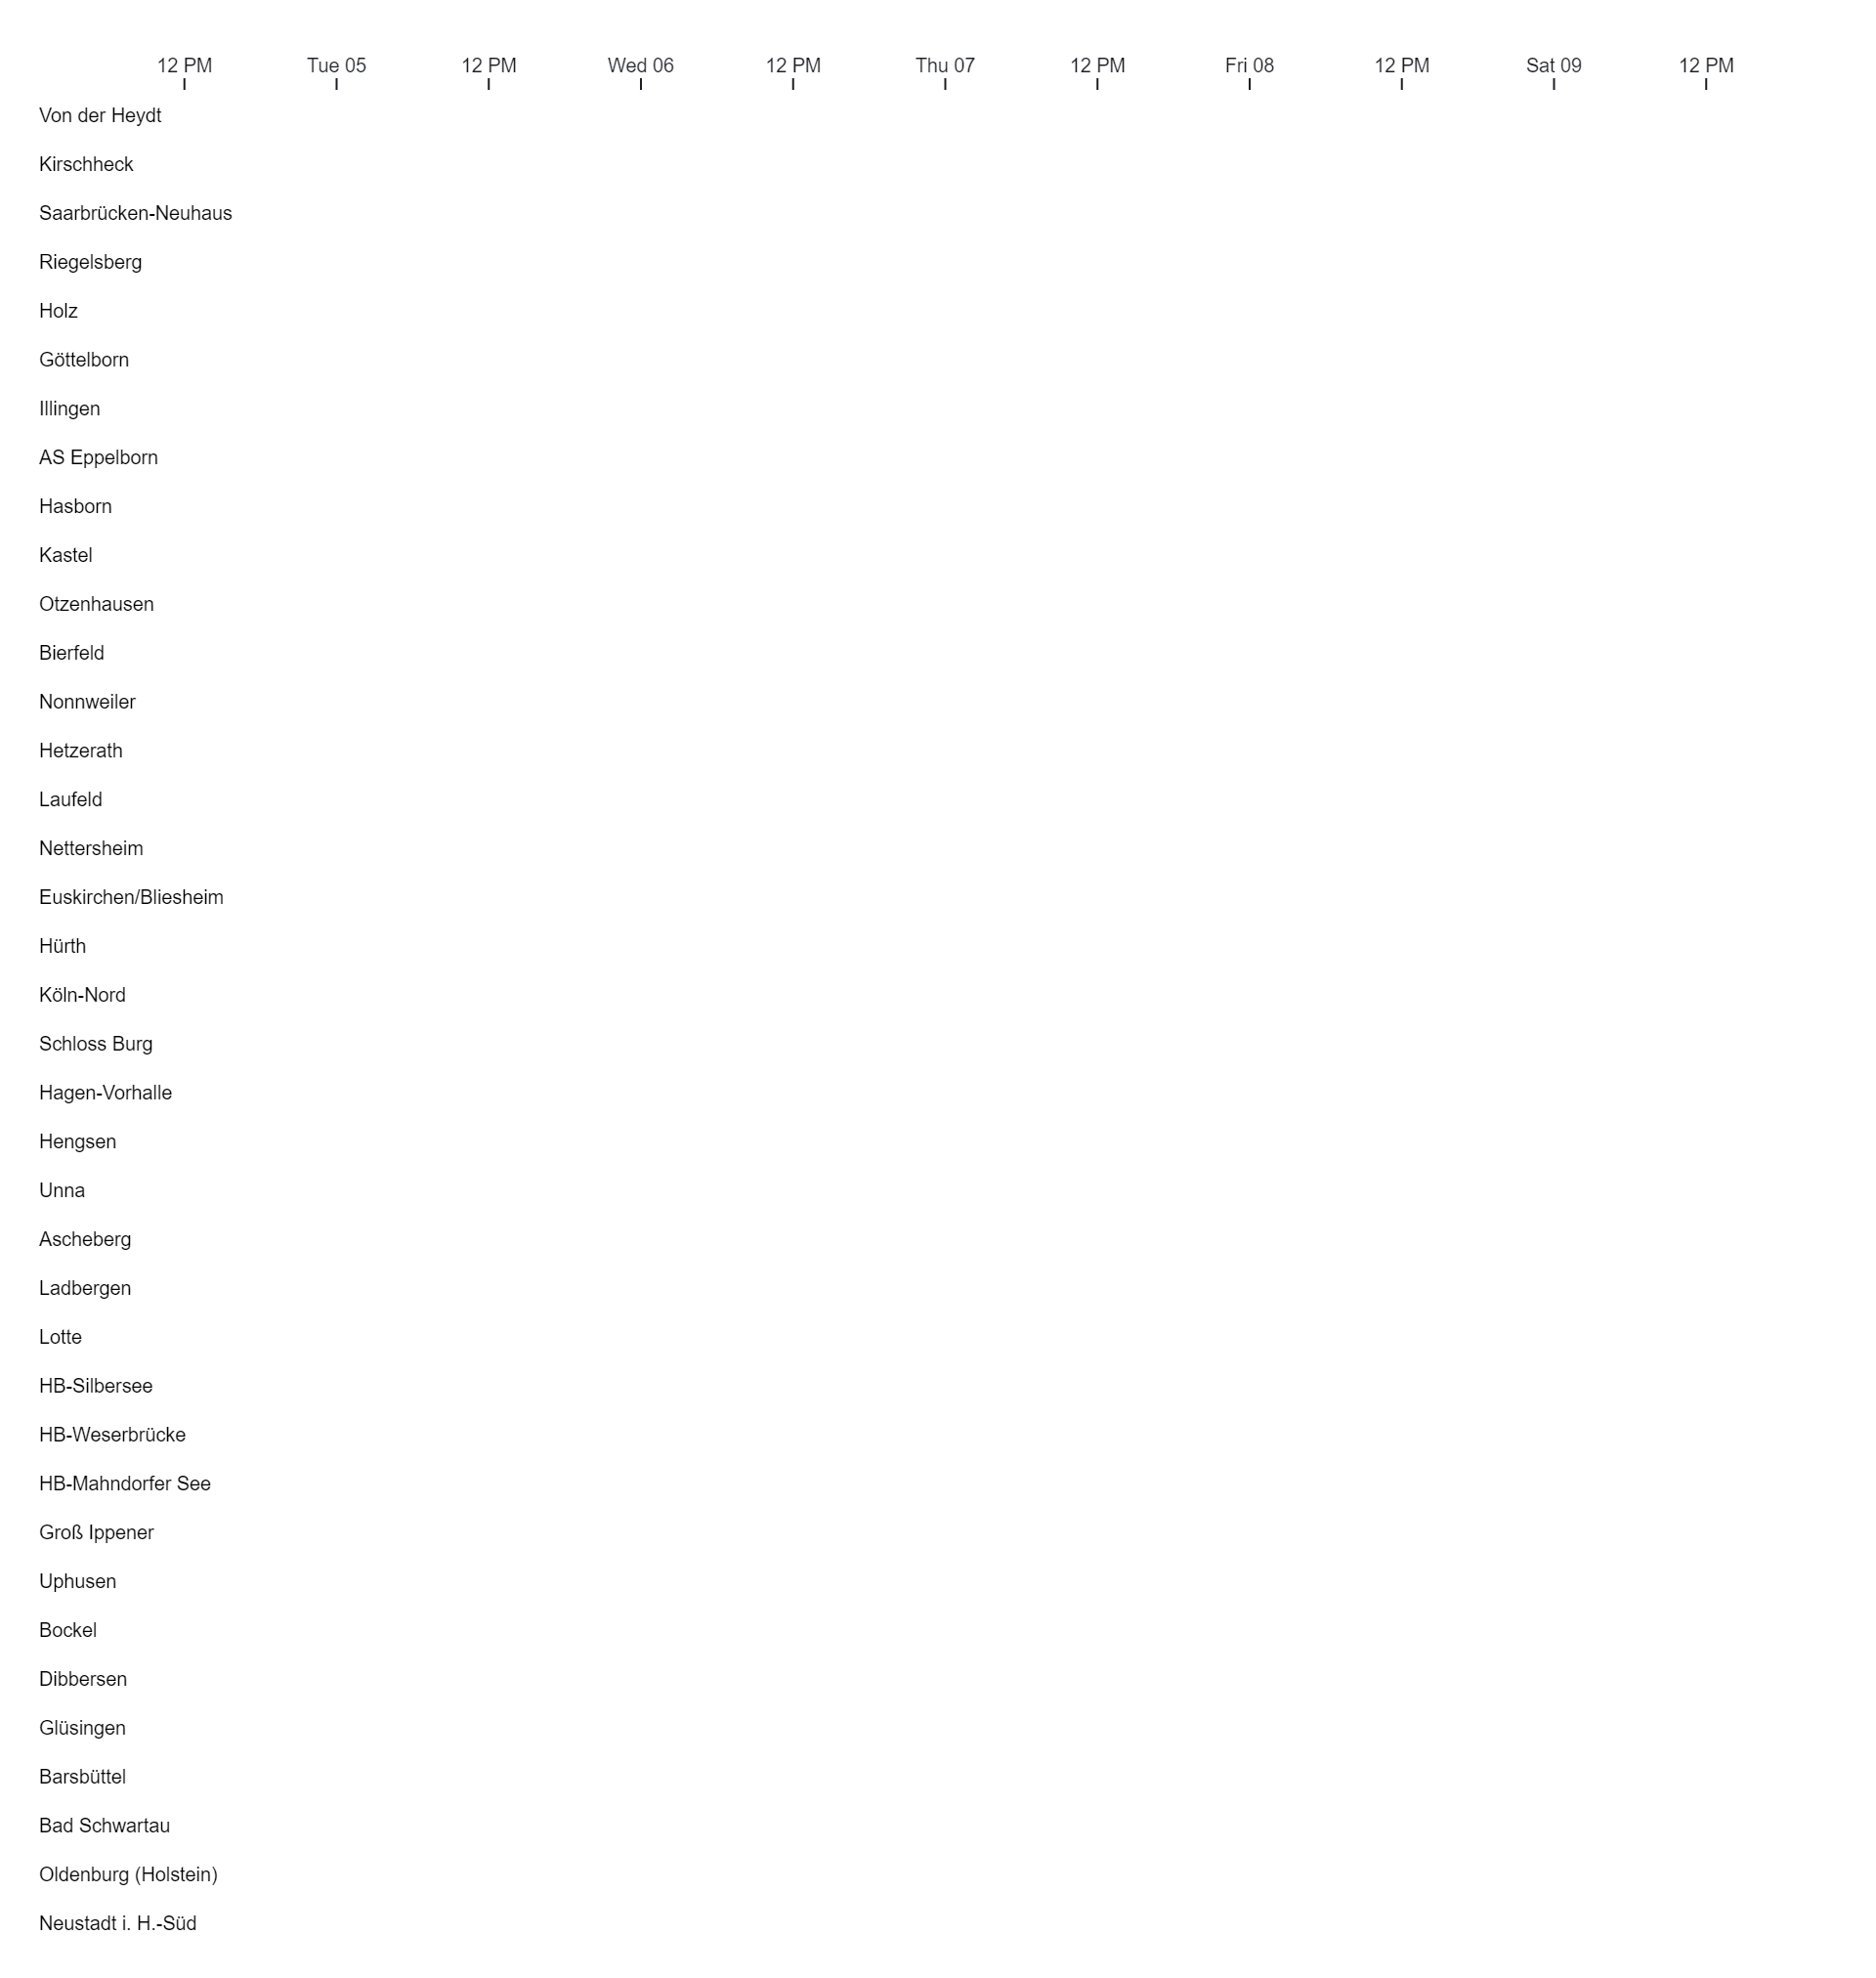
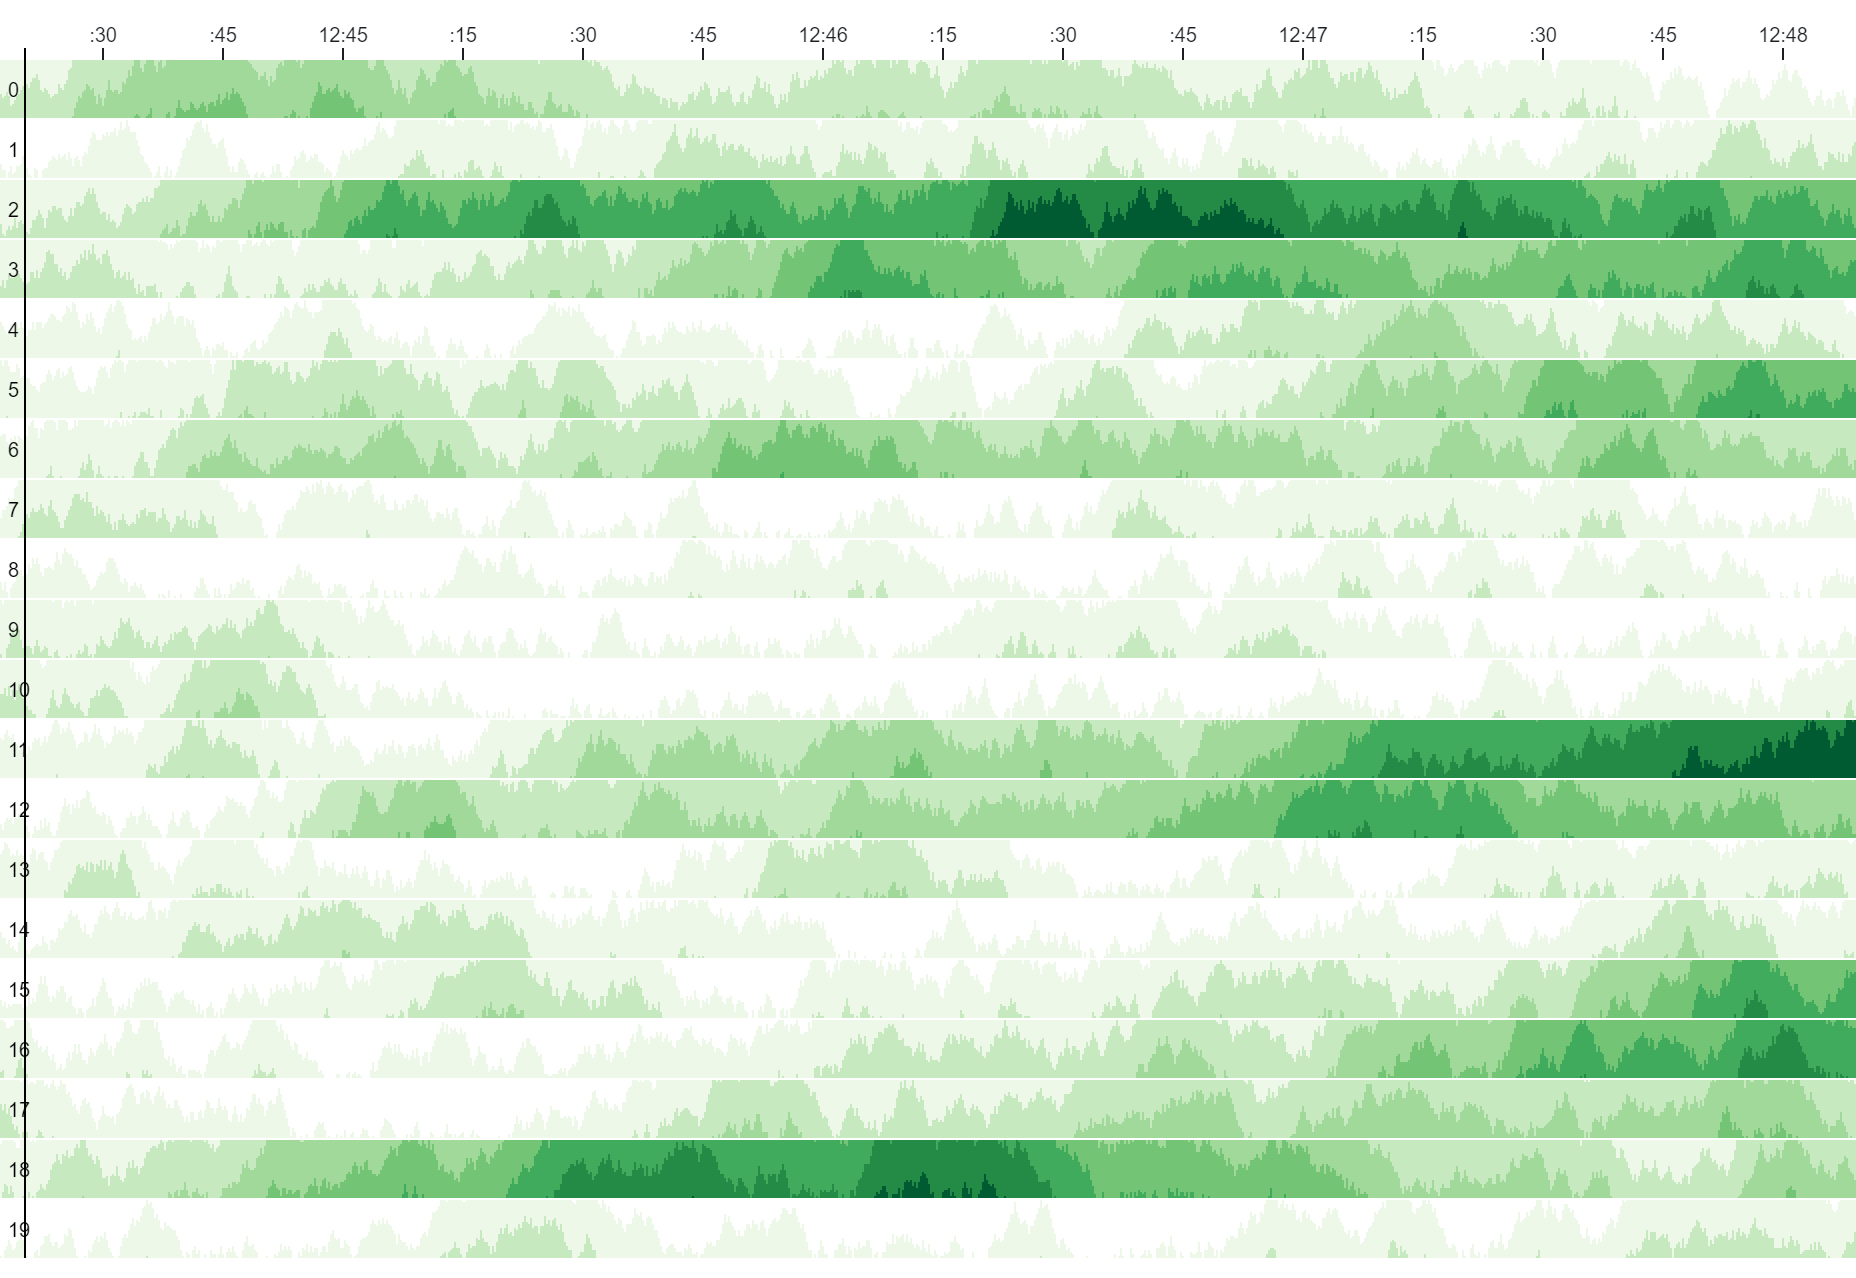
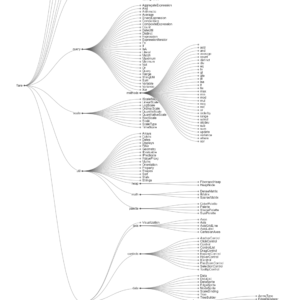
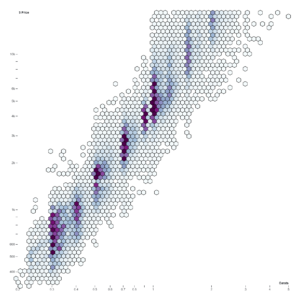
Realtime Horizon charts are a dynamic and efficient data visualization tool used to represent continuously evolving datasets in real-time. Inspired by traditional horizon charts, which compress large datasets by stacking them vertically, realtime horizon charts add a temporal dimension to this visualization technique. As data streams in over time, the chart updates dynamically, shifting and adjusting to accommodate new data points while maintaining a compact and readable format. Each band in the chart represents a specific time interval, such as minutes, hours, or days, and within each band, the data values are stacked vertically to provide a comprehensive view of the dataset’s evolution. Realtime horizon charts are particularly useful for monitoring rapidly changing data streams, such as stock prices, sensor readings, network traffic, or social media mentions. By compressing time-series data and providing a continuous visual representation of changes, they enable users to quickly identify trends, anomalies, or patterns as they occur in real-time. Realtime horizon charts are commonly used in various industries and applications where timely insights into streaming data are critical for decision-making and analysis. They offer a visually compelling and efficient way to monitor and analyze dynamic datasets, making them a valuable tool for real-time data visualization and monitoring.
Uses:
- Stock Market Monitoring: Realtime Horizon charts are used to monitor stock market activity, displaying real-time changes in stock prices and trading volumes.
- Network Traffic Analysis: They are employed to monitor network traffic in real-time, identifying fluctuations or anomalies in data transmission.
- Sensor Data Visualization: Realtime Horizon charts help visualize sensor data streams, such as temperature, pressure, or humidity readings, in real-time.
- Social Media Monitoring: They aid in monitoring social media activity by visualizing real-time mentions, interactions, or trends across various platforms.
- Website Analytics: Realtime Horizon charts are used to track website traffic and user interactions in real-time, enabling website owners to monitor performance and detect unusual activity.
- Financial Trading: They assist traders in monitoring financial markets and making real-time decisions based on changes in market conditions, such as price movements and trading volumes.
- Healthcare Monitoring: Realtime Horizon charts are employed in healthcare settings to monitor patient vital signs, such as heart rate, blood pressure, or oxygen levels, in real-time.
- Weather Forecasting: They aid in weather forecasting by visualizing real-time weather data, such as temperature, precipitation, and wind speed, to identify patterns and trends.
- Supply Chain Management: Realtime Horizon charts help monitor supply chain operations in real-time, tracking inventory levels, order fulfillment, and transportation logistics.
- Energy Monitoring: They are used in energy management systems to monitor real-time energy consumption, production, and distribution across various sources and facilities.
Purposes:
- Monitoring: The primary purpose of Realtime Horizon charts is to monitor continuously evolving datasets in real-time, providing timely insights into changing conditions.
- Detection of Anomalies: They aid in the detection of anomalies or irregularities in data streams by visualizing deviations from expected patterns in real-time.
- Trend Analysis: Realtime Horizon charts help analyze trends and patterns in real-time data streams, enabling users to identify emerging trends or shifts in behavior.
- Decision-Making Support: They support real-time decision-making by providing stakeholders with up-to-date information and insights into dynamic data streams.
- Performance Evaluation: Realtime Horizon charts assist in evaluating the performance of systems, processes, or assets in real-time, facilitating proactive management and optimization.
- Alerting and Notification: They serve as an alerting mechanism, notifying users of significant changes or events in real-time data streams through visual cues or alarms.
- Resource Optimization: Realtime Horizon charts aid in optimizing resource allocation and utilization by providing real-time visibility into resource availability and demand.
- Risk Management: They help manage risks by monitoring real-time data streams for potential threats, vulnerabilities, or disruptions to operations.
- Process Monitoring: Realtime Horizon charts assist in monitoring and optimizing business processes, manufacturing operations, or service delivery in real-time.
- Performance Monitoring: They support performance monitoring and evaluation by providing real-time visibility into key performance indicators and metrics across various domains and industries.

Reviews
There are no reviews yet.