
Description
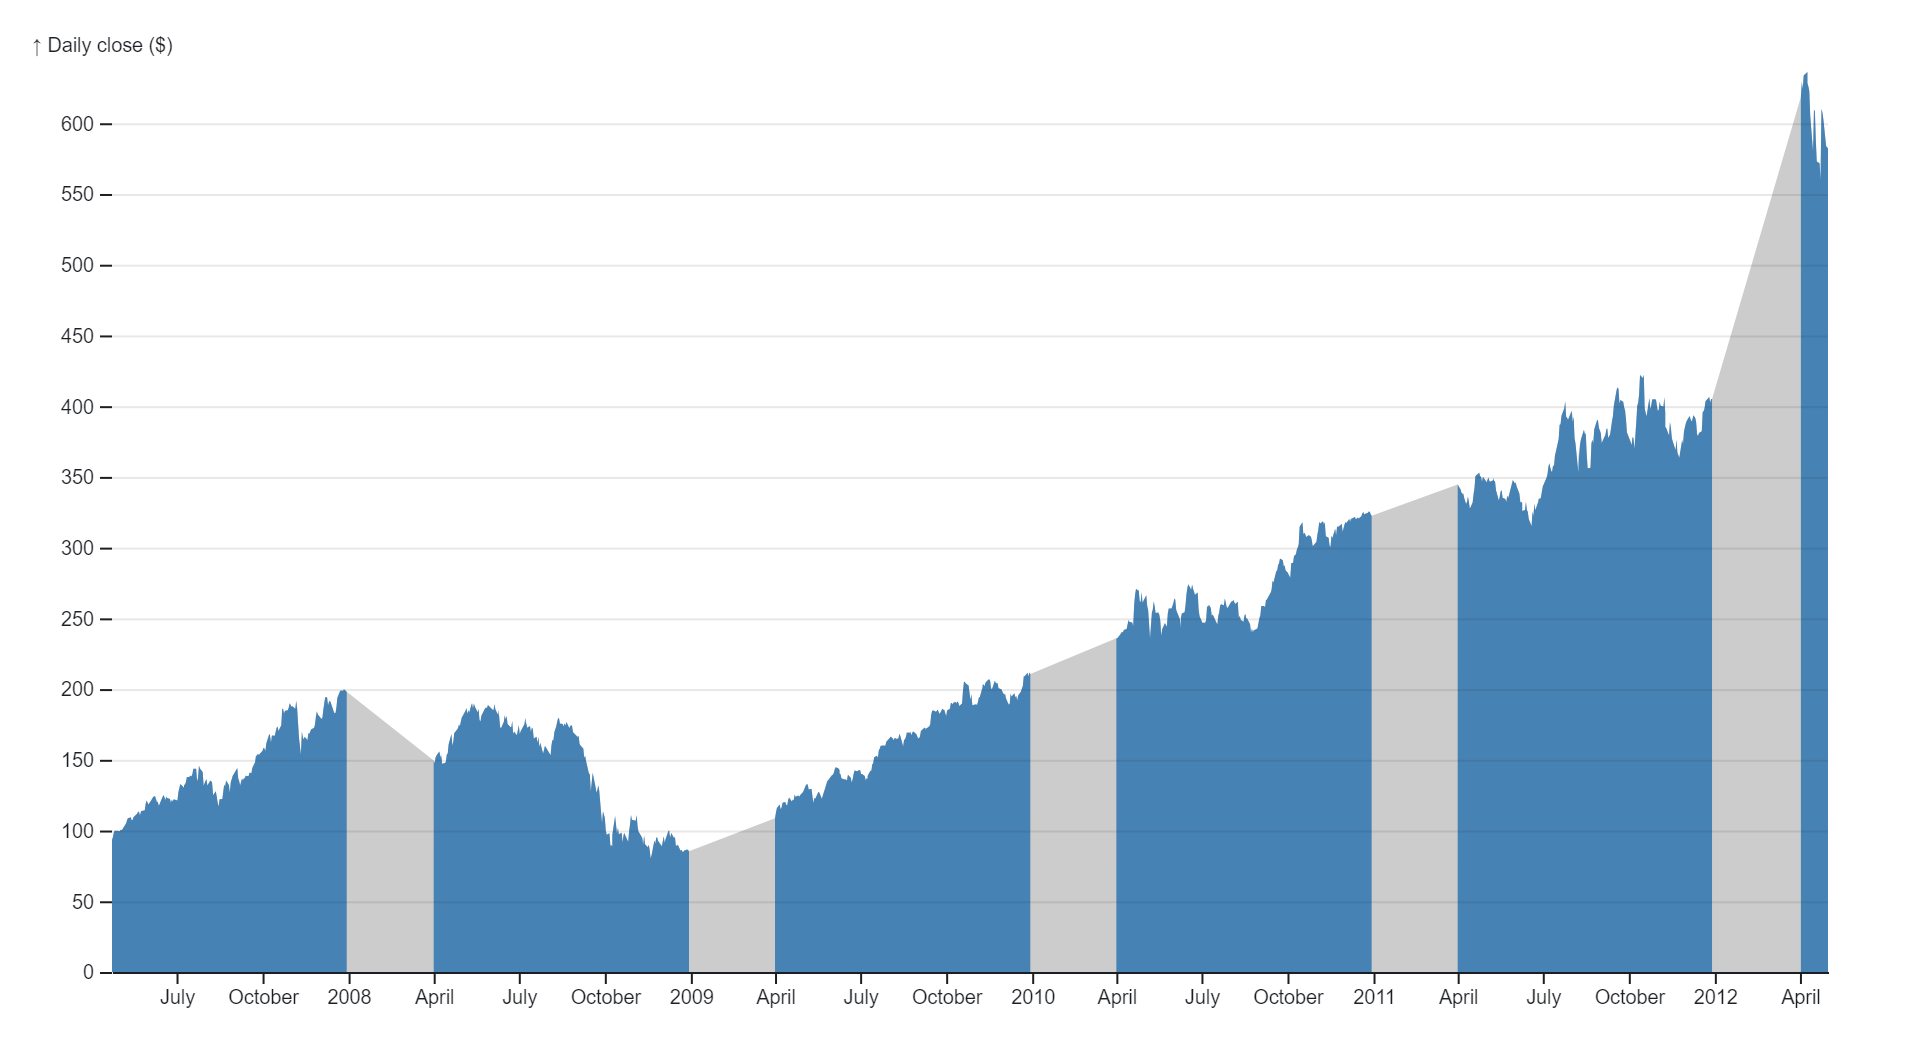
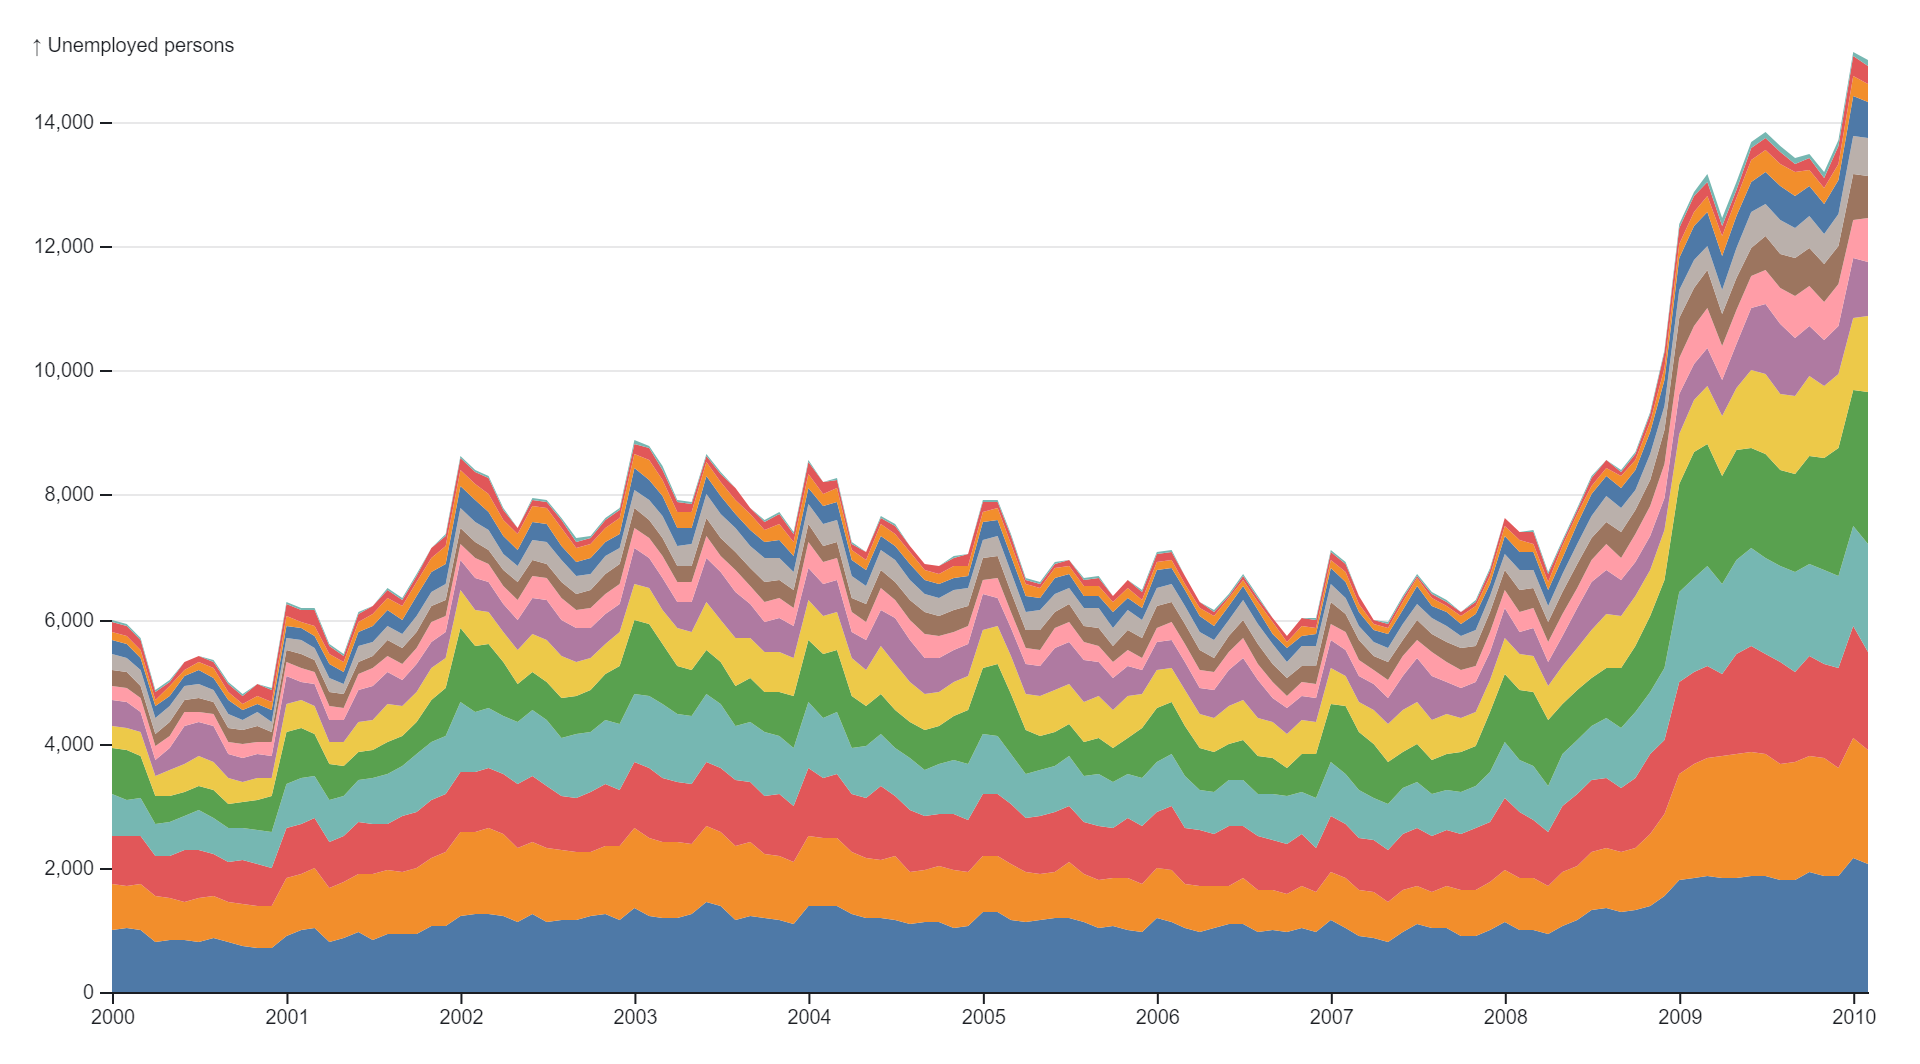
A stacked area chart is a data visualization tool commonly used to display the cumulative values of multiple variables over time or across different categories. In this chart, each variable is represented as a colored area, with the areas stacked on top of one another to form a composite whole. The vertical axis typically represents the magnitude or proportion of the variables, while the horizontal axis denotes time or the categories being compared. Stacked area charts provide a clear visual representation of the contribution of each variable to the total, as well as the overall trend over the specified time period or categories. They are effective for illustrating changes in the composition of data sets over time, as well as for identifying patterns or trends within individual variables or the total. Stacked area charts are commonly used in fields such as finance, where they can depict changes in market share or portfolio composition, and in data analysis, where they can visualize trends in multi-dimensional data sets. They offer a visually intuitive way to analyze and interpret complex data relationships, making them a valuable tool for decision-making and communication.
Uses:
- Comparison of Trends: Stacked Area Charts are used to compare trends in multiple variables over time, providing insights into how each variable contributes to the overall trend.
- Composition Analysis: They assist in analyzing the composition of a dataset by visualizing the relative proportions of different categories or components over time.
- Tracking Changes: Stacked Area Charts help track changes in the distribution of variables over time, enabling users to identify shifts in patterns or trends.
- Visualizing Market Share: They are commonly used in business to visualize market share trends for different products, brands, or competitors over time.
- Budget Allocation: Stacked Area Charts aid in visualizing budget allocations across different expense categories or departments over time.
- Resource Utilization: They help monitor resource utilization by visualizing the allocation of resources, such as manpower or funding, across various projects or activities over time.
- Sales Analysis: Stacked Area Charts assist in analyzing sales performance by visualizing sales trends for different product categories or regions over time.
- Website Traffic Analysis: They are used to analyze website traffic patterns by visualizing the distribution of traffic sources or user interactions over time.
- Supply Chain Management: Stacked Area Charts aid in supply chain management by visualizing inventory levels, production volumes, or order fulfillment rates over time.
- Performance Monitoring: They support performance monitoring by visualizing key performance indicators (KPIs) or metrics across different departments, regions, or time periods.
Purposes:
- Trend Comparison: The primary purpose of Stacked Area Charts is to compare trends in multiple variables or categories over time.
- Composition Analysis: They help analyze the composition of a dataset by visualizing the relative proportions of different components or categories.
- Pattern Recognition: Stacked Area Charts aid in identifying patterns or trends in the distribution of variables over time.
- Decision Support: They support decision-making processes by providing insights into changes in data distribution or trends over time.
- Performance Evaluation: Stacked Area Charts assist in evaluating performance metrics or KPIs across different dimensions or categories.
- Resource Planning: They aid in resource planning and allocation by visualizing resource utilization patterns over time.
- Data Exploration: Stacked Area Charts facilitate data exploration by enabling users to interactively analyze and explore trends in the data.
- Forecasting: They support forecasting future trends or projections based on historical data trends depicted in the chart.
- Communication: Stacked Area Charts serve as a communication tool for presenting complex data relationships in a visually intuitive format.
- Pattern Detection: They help detect deviations or anomalies from expected patterns in the distribution of variables over time.
Only logged in customers who have purchased this product may leave a review.
Related products
-
- Sale!
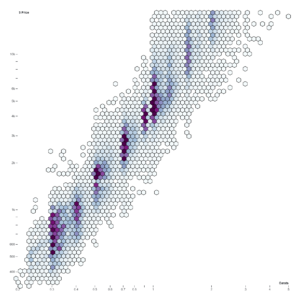
Hexbin
- Original price was: $ 15.$ 10Current price is: $ 10.
- Add to cart
-
- Sale!
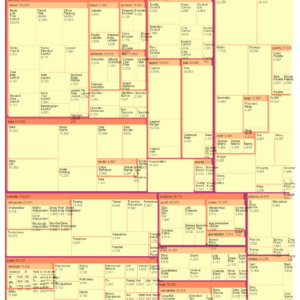
Cascaded Tree Map
- Original price was: $ 15.$ 10Current price is: $ 10.
- Add to cart
-
- Sale!
Kernal Density Estimation
- Original price was: $ 15.$ 10Current price is: $ 10.
- Add to cart
Reviews
There are no reviews yet.