Description
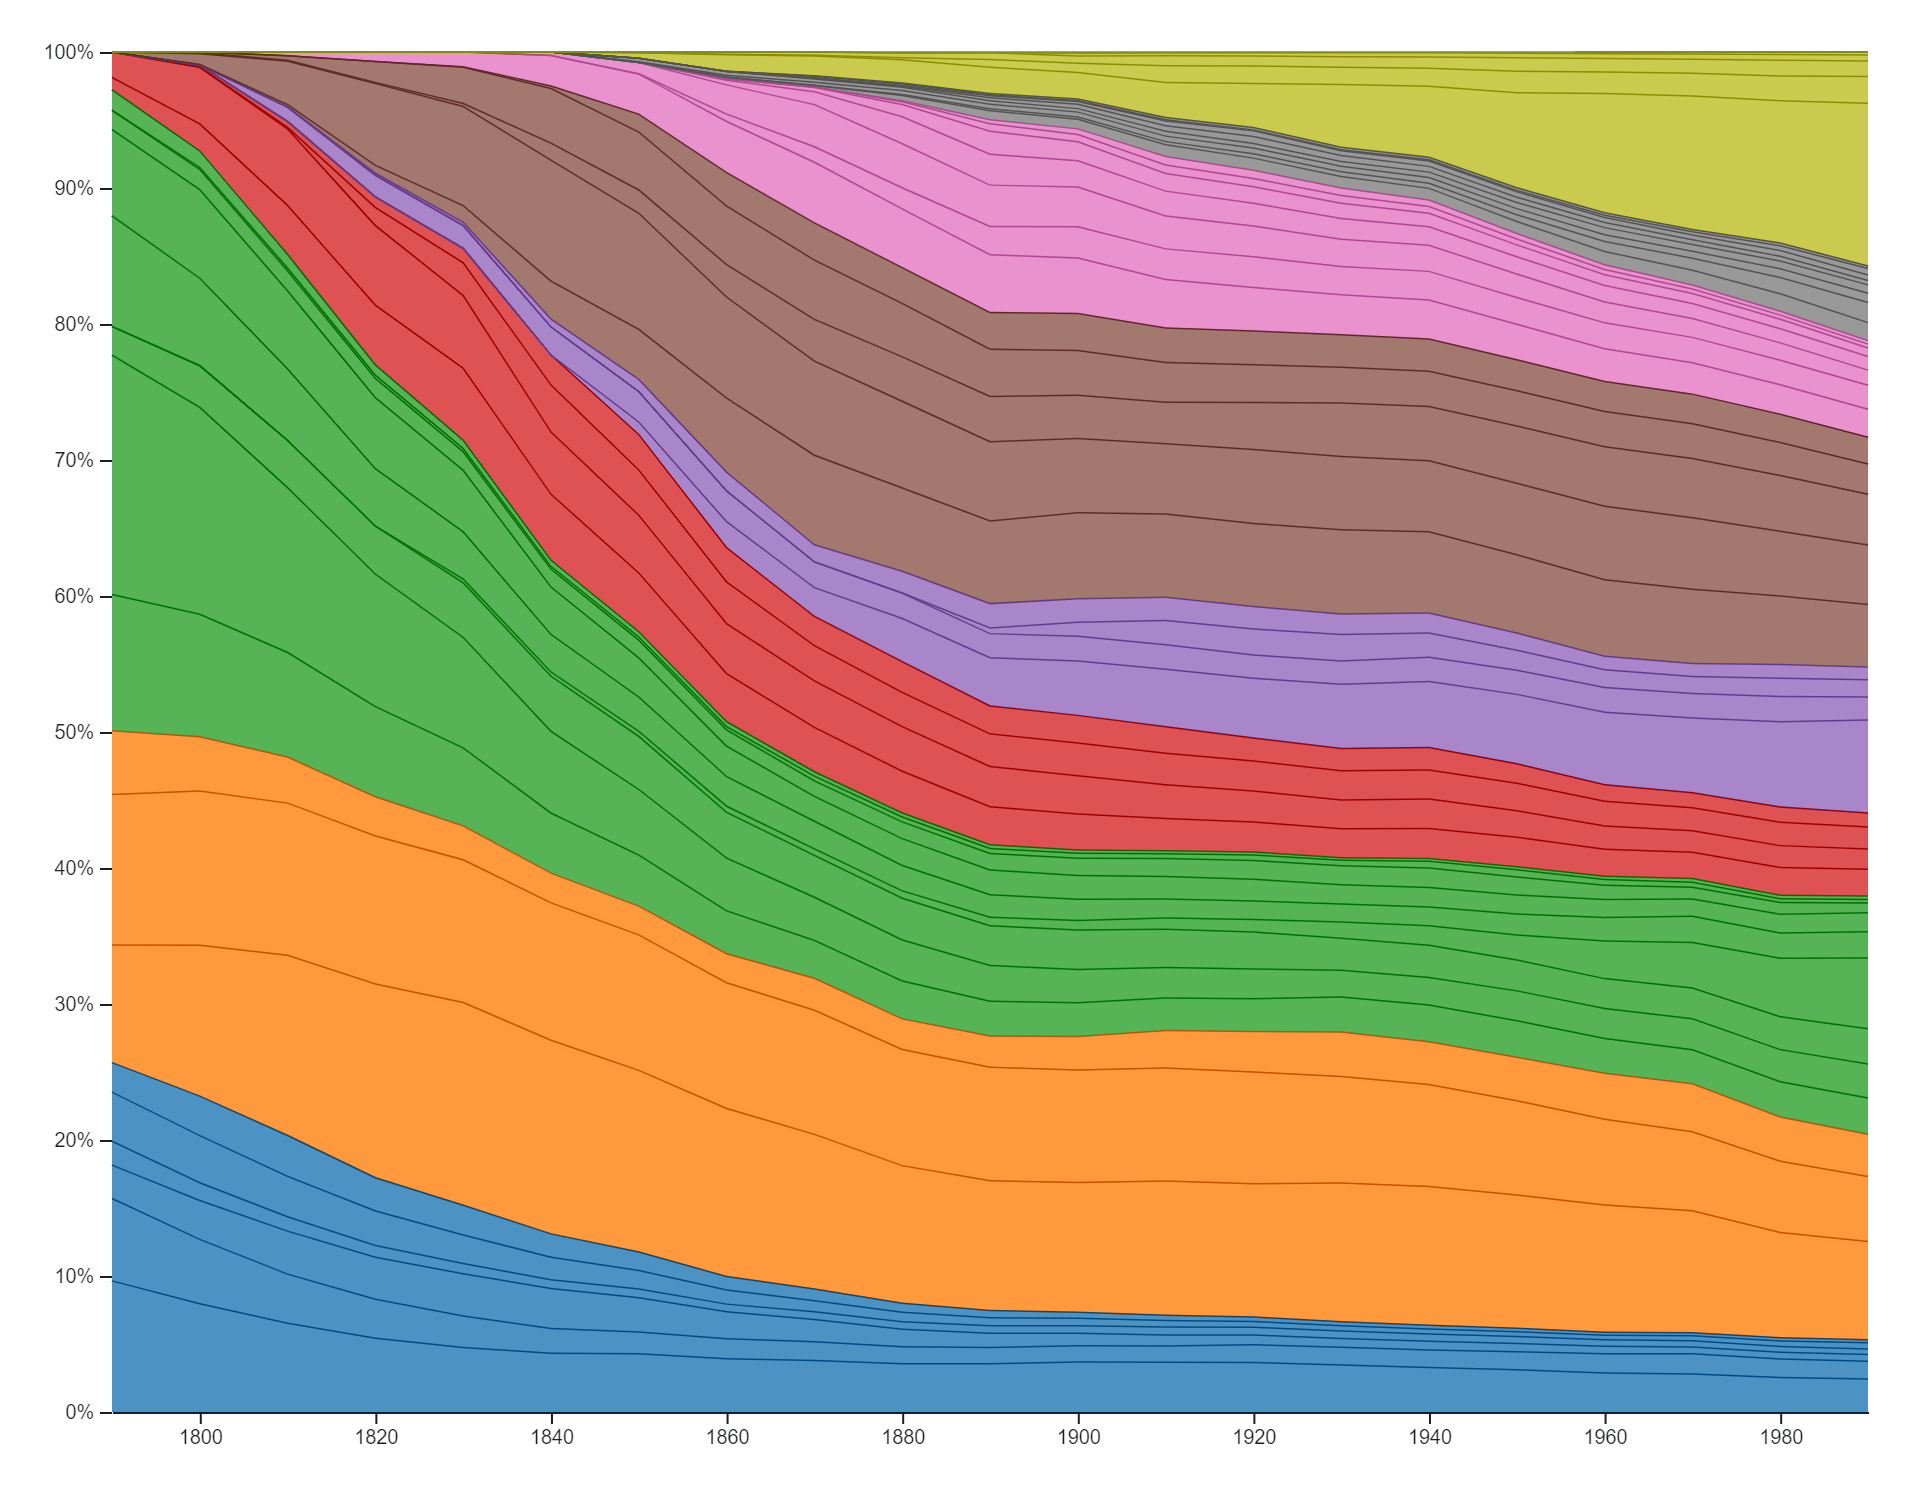
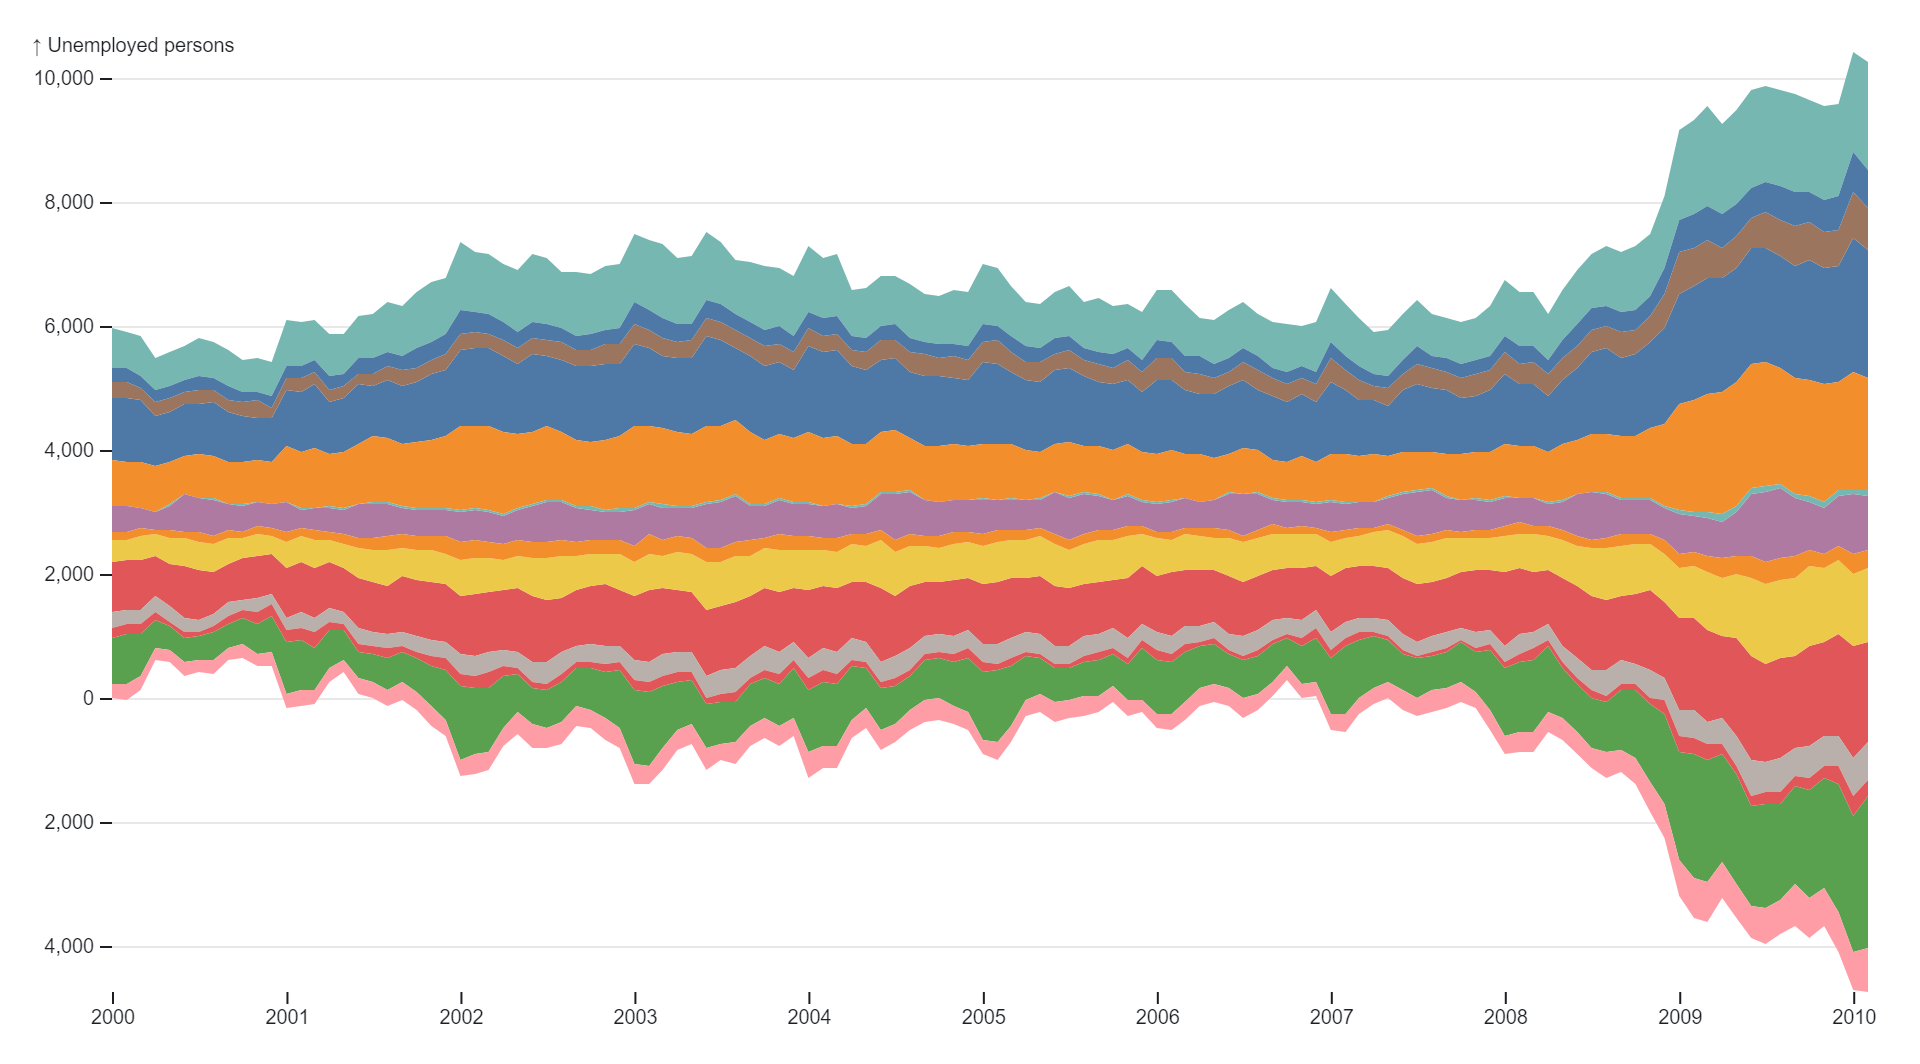
A Streamgraph chart is a data visualization tool that displays the changes in the composition of a dataset over time or across categories. It is similar to a stacked area chart but differs in its design, as it emphasizes the continuity and flow of the data rather than focusing on precise values. In a Streamgraph chart, the data is represented by a series of smoothly flowing, stacked curves, with each curve corresponding to a different category or variable. The curves are layered on top of each other to form a visually cohesive whole, with the width of each curve representing the relative proportion of the category at any given point in time. The colors are typically chosen to enhance the visual distinction between the curves, making it easier to differentiate between the categories. Streamgraph charts are effective for visualizing changes in the distribution or composition of data over time, as they allow users to identify trends, patterns, and shifts in the data with a quick glance. They are commonly used in fields such as finance, where they can depict changes in market share or portfolio composition, and in data analysis, where they can visualize trends in multi-dimensional datasets. Streamgraph charts offer a visually engaging and intuitive way to explore and understand complex data relationships, making them a valuable tool for data analysis and communication.
Uses:
- Trend Analysis: Streamgraph charts are used to analyze trends in the distribution of data over time, allowing users to identify patterns or shifts in the composition of the dataset.
- Composition Visualization: They assist in visualizing the composition of a dataset by displaying the relative proportions of different categories or variables over time.
- Market Share Analysis: Streamgraph charts help visualize changes in market share for different products, brands, or competitors over time, providing insights into competitive dynamics.
- Portfolio Analysis: They are commonly used in finance to analyze changes in portfolio composition, asset allocations, or sector weightings over time.
- Website Traffic Analysis: Streamgraph charts aid in visualizing website traffic patterns, such as the distribution of traffic sources or user interactions, over time.
- Social Media Monitoring: They assist in monitoring social media activity by visualizing changes in the volume or distribution of mentions, interactions, or trends over time.
- Sales Performance Analysis: Streamgraph charts are used to analyze sales performance by visualizing changes in sales volumes or revenue contributions across different product categories or regions over time.
- Supply Chain Management: They help visualize changes in supply chain dynamics, such as inventory levels, production volumes, or order fulfillment rates, over time.
- Healthcare Analytics: Streamgraph charts aid in healthcare analytics by visualizing changes in patient demographics, disease prevalence, or treatment outcomes over time.
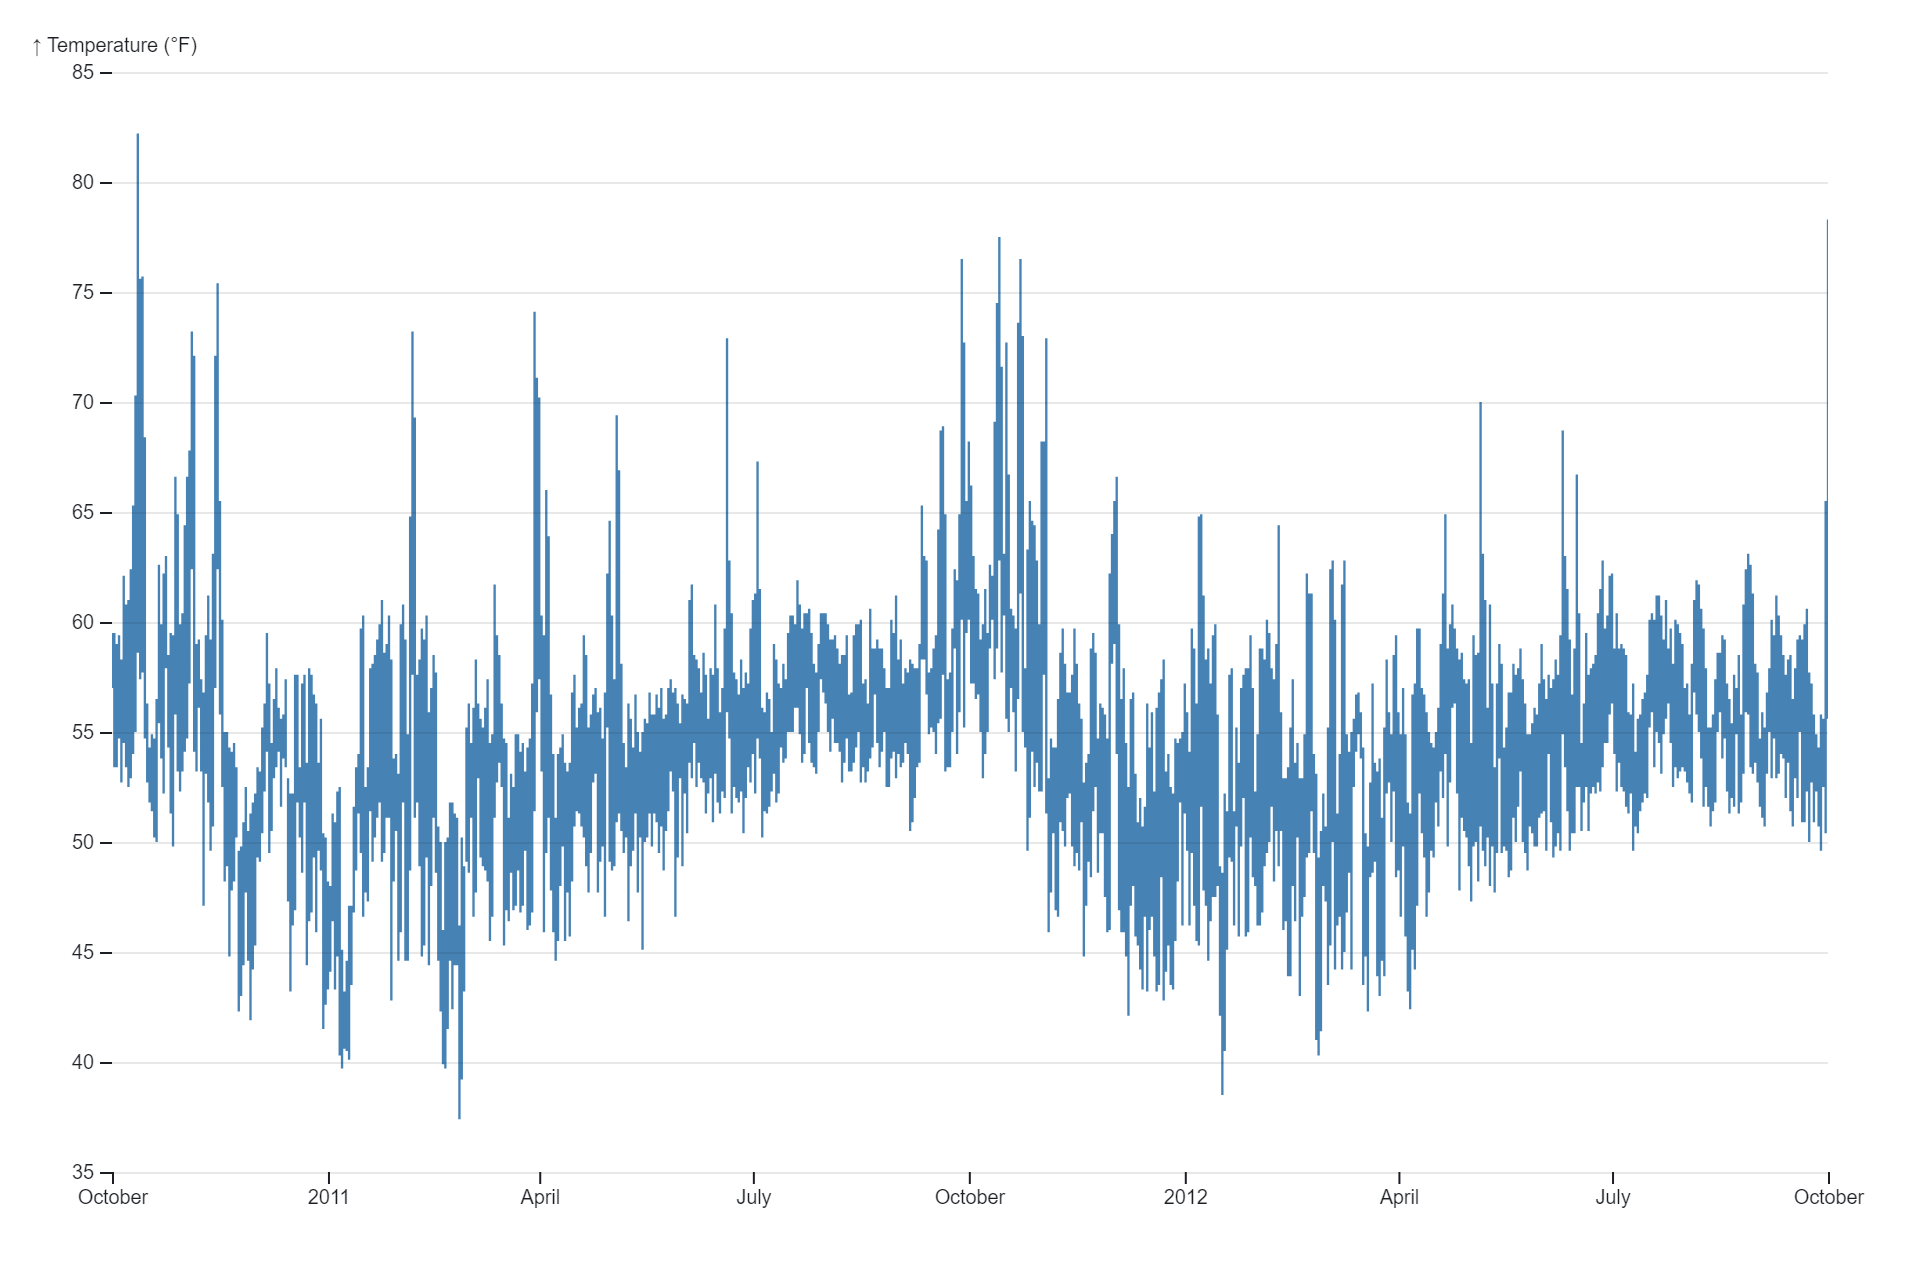
- Environmental Monitoring: They assist in visualizing changes in environmental parameters, such as temperature, precipitation, or air quality, over time.
Purposes:
- Trend Identification: The primary purpose of Streamgraph charts is to identify trends and patterns in the distribution of data over time.
- Composition Analysis: They aid in analyzing the composition of a dataset by visualizing the relative proportions of different categories or variables over time.
- Pattern Recognition: Streamgraph charts help recognize patterns or shifts in the distribution of data over time, facilitating insights into underlying dynamics.
- Decision Support: They support decision-making processes by providing insights into changes in data distribution or trends over time.
- Performance Evaluation: Streamgraph charts assist in evaluating performance metrics or KPIs across different dimensions or categories.
- Resource Planning: They aid in resource planning and allocation by visualizing changes in resource utilization patterns over time.
- Data Exploration: Streamgraph charts facilitate data exploration by enabling users to interactively analyze and explore trends in the data.
- Forecasting: They support forecasting future trends or projections based on historical data trends depicted in the chart.
- Communication: Streamgraph charts serve as a communication tool for presenting complex data relationships in a visually intuitive format.
- Anomaly Detection: They help detect deviations or anomalies from expected pattern
Only logged in customers who have purchased this product may leave a review.
Reviews
There are no reviews yet.