Description
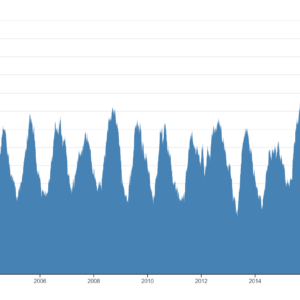
“The impact of vaccines” charts serve as powerful tools for visualizing the effects and outcomes of vaccination programs on public health. These charts typically present data related to disease incidence, prevalence, or mortality rates before and after the introduction of vaccines. By comparing these metrics over time, these charts illustrate the significant reductions in disease burden and associated health outcomes attributed to vaccination efforts. The charts may feature line graphs, bar graphs, or other visualizations to depict trends in disease rates or outcomes pre- and post-vaccination. Additionally, they may include annotations or labels to highlight key events, such as vaccine introductions or policy changes, that have influenced the observed trends. The goal of “The impact of vaccines” charts is to provide clear and compelling evidence of the effectiveness of vaccination programs in preventing disease and improving public health. These charts are widely used by public health authorities, policymakers, and advocacy groups to communicate the value of vaccines and to support decision-making related to vaccination policies and programs. Overall, “The impact of vaccines” charts serve as essential tools for promoting understanding, trust, and confidence in vaccination as a critical public health intervention.
Uses:
- Public Health Education: These charts are used to educate the public about the benefits of vaccination in preventing infectious diseases.
- Policy Advocacy: They serve as advocacy tools to promote vaccination policies and programs at local, national, and global levels.
- Professional Training: “The Impact of Vaccines” charts are used in healthcare professional training programs to illustrate the effectiveness of vaccines in preventing diseases.
- Community Engagement: They are used in community outreach programs to engage community members in discussions about vaccination and disease prevention.
- Media Reporting: These charts are often used by journalists and media outlets to report on vaccination-related topics and public health initiatives.
- Research and Analysis: Researchers use these charts to analyze trends in disease incidence and vaccination coverage over time and to evaluate the impact of vaccination programs.
- Program Evaluation: Public health agencies and organizations use these charts to evaluate the effectiveness of vaccination programs and to identify areas for improvement.
- International Development: “The Impact of Vaccines” charts are used in international development efforts to promote vaccination as a key component of global health initiatives.
- Emergency Response: They are used in emergency response situations, such as disease outbreaks, to assess the effectiveness of vaccination campaigns in controlling the spread of infectious diseases.
- Parental Decision-Making: Parents use these charts to make informed decisions about vaccinating their children and to understand the potential benefits of vaccination.
Purposes:
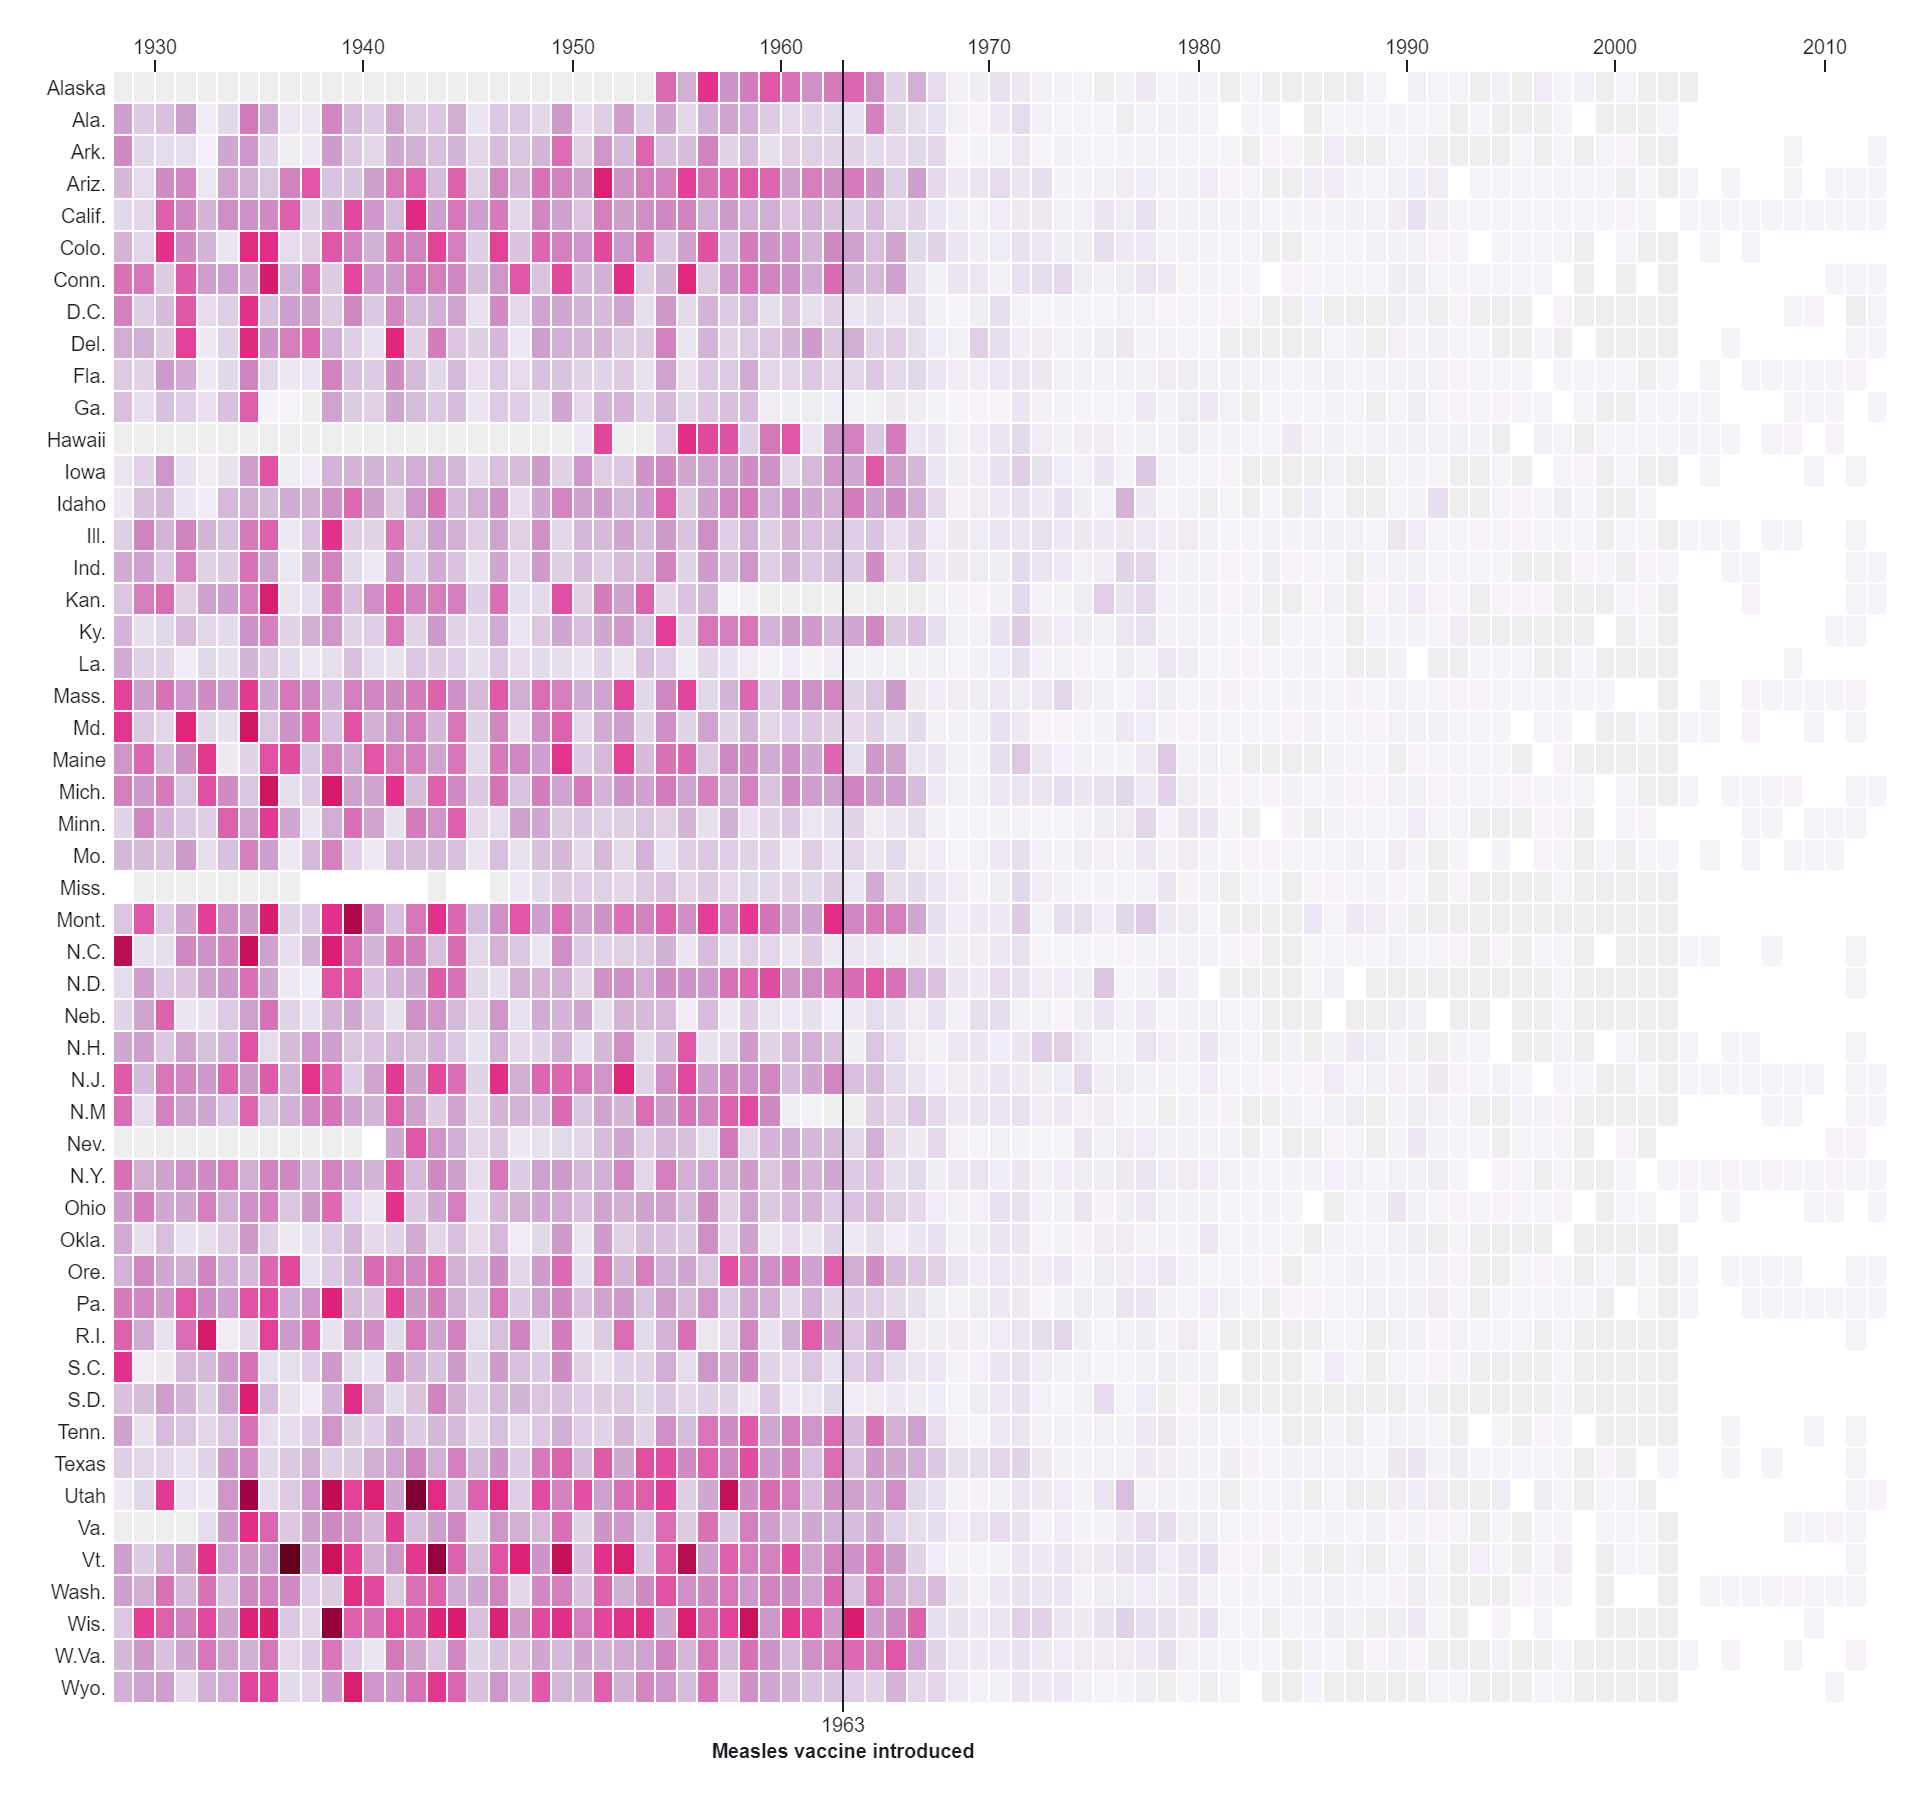
- Demonstrating Disease Reduction: The primary purpose of these charts is to demonstrate the reduction in disease incidence or prevalence following the introduction of vaccines.
- Highlighting Vaccine Effectiveness: They illustrate the effectiveness of vaccines in preventing specific diseases and reducing their impact on public health.
- Showing Herd Immunity: These charts show how high vaccination rates can contribute to herd immunity, protecting vulnerable populations from infectious diseases.
- Tracking Vaccination Coverage: They track vaccination coverage rates over time to assess progress towards vaccination goals and targets.
- Evaluating Vaccine Safety: “The Impact of Vaccines” charts may also be used to evaluate the safety of vaccines by comparing disease rates before and after vaccine introduction.
- Supporting Policy Decisions: They provide evidence to policymakers to support decisions related to vaccination policies, funding allocations, and public health initiatives.
- Raising Awareness: These charts raise awareness about the importance of vaccination in preventing diseases and saving lives.
- Addressing Vaccine Hesitancy: They help address vaccine hesitancy by providing clear and compelling evidence of the benefits of vaccination.
- Monitoring Disease Trends: They monitor trends in disease incidence and prevalence to identify emerging infectious diseases and inform public health responses.
- Promoting Equity: “The Impact of Vaccines” charts highlight the role of vaccination in promoting health equity by reducing disparities in disease burden among different populations.
Only logged in customers who have purchased this product may leave a review.
Related products
-
- Sale!
Clustre Dendogram
- Original price was: $ 15.$ 10Current price is: $ 10.
- Add to cart
-
- Sale!
Moving Average Chart
- Original price was: $ 15.$ 10Current price is: $ 10.
- Add to cart
-
- Sale!
Circle Packing
- Original price was: $ 15.$ 10Current price is: $ 10.
- Add to cart
Reviews
There are no reviews yet.